
Page 67 - bne magazine February 2022_20220208
P. 67
bne February 2022
behaviour over Ukraine using economic sanctions is limited," pointed out Richard Grieveson, deputy director of wiiw.
Conservative monetary and fiscal policies have enabled Russia to build up substantial foreign exchange reserves of $630bn. Gross foreign exchange reserves, including gold, accounted for about 40% of Russia’s GDP in November. External debt is low, and there has also been a reduction
in exposure to the US dollar in government bonds.
The wiiw now forecasts average growth in 2022 in the V4 states of Central Europe at 4.4%, followed by 4.4% in 2023. For 2022, it now views the growth prospects of Bulgaria (3.8%), Czechia (4.0%), Serbia (4.9%) and North Macedonia (3.5%) in a somewhat more positive light. Meanwhile, Belarus (1.0%), Bosnia and Herzegovina (2.5%) and Slovakia (3.9%) have experienced a downward revision.
The wiiw says high inflation is the biggest risk to economic recovery in the CESEE region – ranking ahead of
Central Europe I 67 The wiiw report, however, warns that
inflation risks becoming entrenched in Eastern Europe if it leads to a wage-
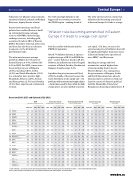
Overview 2020-2021 and Outlook 2022-2024
OVERVIEW 2020-2021 AND OUTLOOK 2022-2024
BG Bulgaria CZ Czechia EE Estonia HR Croatia HU Hungary LT Lithuania LV Latvia PL Poland RO Romania SI Slovenia SK Slovakia
EU-CEE11 1)2)
EA19 3) EU27 3)
AL Albania
BA Bosnia and Herzegovina
ME Montenegro
MK North Macedonia
RS Serbia
XK Kosovo
WB6 1)2)
TR Turkey
BY Belarus
KZ Kazakhstan MD Moldova RU Russia
UA Ukraine
CIS4+UA 1)2) V4 1)2)
BALT3 1)2) SEE9 1)2) CIS3+UA 1)2) non-EU12 1)2) CESEE23 1)2)
3.5 1.2 3.6 3.3 3.3 -0.6 3.3 0.0 3.7 3.4 2.9 1.1 3.0 0.1 4.3 3.7 4.8 2.3 3.0 -0.3 3.3 2.0
3.5 2.5 5.1 2.5 2.2 2.6 2.8 2.2 6.8 2.0 1.9 7.5 3.7 3.2 4.3 2.8 2.0 8.5 3.1 2.5 8.1 3.6 3.0 3.2 3.0 3.5 5.0 1.5 1.5 5.0 2.5 2.0 6.7 3.1 2.8 4.4
1.8 1.7 7.9 2.0 1.9 7.1
5.0 4.5 2.9 2.5 6.5 5.8 8.0 7.0 4.2 3.9 7.2 6.8 7.6 6.9 3.2 3.0 4.8 4.5 4.3 4.0 6.9 6.5 4.3 4.0
7.7 7.3 6.9 6.5
GDP
real change in % against prev. year
Consumer prices
average change in % against prev. year
Unemployment (LFS)
Current account
in % of GDP
Fiscal balance
in % of GDP
2020 20211)
-4.4 3.5 -5.8 2.8 -3.0 7.8 -8.1 8.7 -4.7 6.3 -0.1 5.0 -3.6 4.5 -2.5 5.3 -3.7 6.6 -4.2 6.6 -4.4 3.0 -3.7 5.3
-6.4 5.1 -5.9 5.3
-4.0 8.2
-3.2 4.8 -15.3 11.4 -6.1 4.0 -0.9 7.5 -5.3 8.8 -3.3 7.0
1.8 9.5
-0.7 2.3 -2.5 3.9 -7.4 7.8 -2.7 4.5 -3.8 3.1 -2.7 4.2
-3.6 4.8 -1.7 5.5 -4.2 6.4 -2.9 3.4 -1.4 5.9 -2.1 5.7
Forecast
2022 2023
3.8 3.5 4.0 3.6 3.5 4.0 4.7 4.1 4.5 4.0 3.7 3.3 4.3 3.6 4.9 4.9 4.3 4.5 4.1 3.3 3.9 3.7 4.4 4.3
Forecast
rate in %, annual average
Forecast
Forecast
2022 2023 2024
-0.6 -0.3 0.0 1.0 0.8 0.7 -0.5 -0.2 0.3 0.5 0.4 0.6 -1.0 -0.8 -0.4 1.7 1.5 1.2 -1.9 -1.8 -1.5 1.5 1.3 1.3 -6.5 -5.5 -4.8 4.6 4.7 5.0 -2.4 -2.4 -1.9 -0.4 -0.3 -0.1
1.8 1.9 2.1 1.8 1.9 2.1
-7.1 -6.9 -6.7
-2.9 -3.0 -3.3 -14.9 -13.0 -12.0 -3.0 -3.5 -3.5 -3.5 -3.8 -4.0 -7.0 -6.8 -6.8 -4.6 -4.6 -4.7
-2.0 -2.0 -3.5
0.6 0.4 0.0 -2.5 -2.0 -2.5 -7.5 -7.0 -6.0 6.5 5.0 5.0 -2.0 -2.5 -3.0 4.7 3.5 3.5
0.7 0.5 0.6 0.1 0.1 0.2 -4.4 -3.9 -3.5 -2.0 -2.0 -2.4 2.5 1.7 1.2 1.4 0.9 0.7
Forecast
2022 2023 2024
-3.0 -2.5 -2.0 -5.0 -4.0 -3.2 -2.0 -1.5 -0.8 -2.9 -2.5 -2.5 -5.5 -3.7 -3.0 -4.0 -2.5 -1.9 -4.8 -2.3 -1.7 -4.5 -3.6 -3.0 -6.0 -4.5 -3.0 -2.4 -2.5 -2.1 -5.1 -4.1 -3.0 -4.7 -3.6 -2.8
-3.2 -2.1 -1.8 -2.8 -1.7 -1.4
-3.5 -2.5 -2.0 -0.8 -0.5 0.5 -6.3 -5.0 -4.0 -3.5 -2.5 -2.0 -2.5 -2.0 -2.0 -1.5 -1.5 -1.0 -2.6 -2.0 -1.6
-3.0 -2.5 -2.5
-2.0 -1.0 -1.0 -3.2 -2.6 -2.5 -7.0 -5.0 -5.0 0.8 0.5 0.5 -2.5 -2.0 -2.0 0.0 -0.1 -0.1
-4.8 -3.8 -3.0 -3.7 -2.2 -1.6 -4.4 -3.4 -2.5 -2.9 -2.2 -2.2 -0.9 -0.8 -0.8 -2.3 -1.9 -1.6
4.2 2.9 1.8 4.4 3.1 2.0
4.2 4.0 3.8 2.5 2.8 2.6 4.5 3.0 2.7 3.5 3.2 3.0 4.9 4.5 4.0 4.3 4.0 4.0 4.2 3.9 3.5
3.5 3.5 4.0
1.0 2.0 2.0 4.2 4.4 4.1 4.0 4.5 4.5 2.0 1.5 1.5 3.5 3.5 4.0 2.3 2.0 2.0
4.6 4.4 4.0 3.8 3.5 3.0 4.2 4.2 4.2 3.4 3.7 3.7 2.7 2.5 2.7 3.2 3.0 3.1
2.8 2.8 2.2 1.8 1.1 2.0 2.5 2.0 2.5 2.0 2.5 2.5 2.4 2.1
16.0 12.0
9.0 8.0 6.0 5.5 4.0 4.0 4.4 3.9 5.0 4.5 4.8 4.3
3.3 2.8 2.9 2.2 2.8 2.9 6.0 5.4 7.9 6.4 6.5 5.3
11.7 15.9 17.9 16.4
9.0 25.9 13.0
13.2
4.0 4.9 3.8 5.8 9.5 6.2
3.5 8.0 8.1 7.2 8.0 7.1
11.3 16.9 16.9 15.7 10.0 25.4 13.4
13.1
4.0 4.9 3.8 5.0 9.0 5.6
3.6 7.2 8.1 6.9 7.6 6.8
11.1 16.5 16.3 15.2
9.0 25.0 12.7
12.5
3.9 4.8 3.5 4.7 8.0 5.2
3.4 6.6 7.8 6.4 7.2 6.4
2024
2020
2021 2022
2.8 6.0 3.3 5.3 4.5 5.5 2.7 3.0 5.2 5.0 4.6 4.4 3.2 5.2 5.2 5.3 4.1 5.5 2.0 3.2 2.8 4.5 4.3 5.1
2.6 3.2 2.9 3.4
2.0 2.9 1.9 2.6 2.4 3.6 3.2 3.5 4.1 4.5 3.4 3.2 3.2 3.7
19.6 26.2
9.5 10.0 8.0 6.9 5.1 9.0 6.7 7.1 9.4 6.0 7.2 7.1
4.6 5.2 4.2 4.9 3.6 4.9 8.8 7.0
10.6 12.5 8.7 10.3
2023 2024
2020 20211) 2022
2023
4.0 2.5 4.9 6.7 3.8 6.2 6.5 2.9 4.0 3.9 5.9 3.8
6.9 6.1
10.8 15.9 15.2 14.8
8.5 24.5 12.0
12.0
3.8 4.8 3.0 4.5 8.0 5.0
3.2 6.0 7.1 6.3 6.9 6.0
2024
4.0 2.5 4.7 6.6 3.7 6.0 6.2 2.9 3.5 3.6 5.7 3.6
6.6 5.8
10.5 15.5 14.0 14.5
8.0 24.0 11.6
11.0
3.8 4.8 3.0 4.5 7.0 4.9
3.2 5.8 6.6 5.8 6.5 5.7
2020 20211)
-0.3 -1.1 3.6 0.4 -0.3 -3.7 -0.1 0.6 -1.6 -1.5 7.3 2.8 2.9 -2.7 2.9 1.0 -5.0 -7.0 7.4 5.2 0.1 -2.1 1.2 -0.8
2.8 2.0 2.8 2.0
-8.8 -7.7
-3.8 -2.5 -26.1 -13.5 -3.4 -2.0 -4.1 -3.0 -7.0 -7.5 -5.7 -4.2
-5.0 -2.3
-0.4 1.6 -3.8 -3.2 -7.5 -9.5 2.4 7.3 3.4 -0.9 1.8 5.4
2.2 0.2 4.2 -0.4 -3.9 -4.6 -0.6 -1.8 -0.3 2.9 0.3 1.5
2020 20211)
-4.0 -4.0 -5.6 -6.9 -5.6 -4.0 -7.4 -4.5 -8.0 -7.8 -7.2 -6.2 -4.5 -8.0 -7.1 -5.5 -9.3 -7.0 -7.7 -6.7 -5.5 -7.1 -7.0 -6.2
-7.2 -5.9 -6.9 -5.5
-6.8 -5.0
-5.3 -2.2 -11.1 -3.4 -8.3 -4.3 -8.0 -3.0 -7.6 0.2 -7.5 -3.1
-2.8 -2.8
-1.7 -2.0 -4.0 -3.3 -8.5 -6.0 -4.0 1.0 -5.3 -3.0 -4.1 0.1
-6.8 -6.3 -6.0 -6.1 -7.9 -5.4 -4.3 -3.1 -3.9 -0.8 -5.1 -2.8
4.0
2.7
0.3 0.7
1.6 -1.1 -0.3 1.2 1.6 0.2 0.9
12.3
5.5 6.8 3.8 3.4 2.7 3.7
3.4 0.4 1.6 4.8 6.1 5.1
“Inflation risks becoming entrenched in Eastern Europe if it leads to a wage-cost spiral"
both the conflict with Russia and the COVID-19 pandemic.
After 8.7% inflation last year, it expects a weighted average of 10.3% in CESEE this year – and in Turkey as much as 26.2%. However, the inflation rate in the Visegrád countries of Poland, Czechia, Slovakia and Hungary should average 5.2%.
It predicts that price increases will level off by the middle of the year because the worst distortions on the supply side – the problems with international supply chains – should have eased by then, while the high energy prices are also unlikely to persist.
cost spiral. “If it does, we are in for
a protracted period of inflation that will be significantly higher than most states in Eastern Europe have experienced since 2008,” said Grieveson.
Spending on energy and food accounts for a much higher share
of total spending than it does in Western Europe. As a consequence, the governments of Hungary, Serbia and North Macedonia have already introduced price controls on food, not least for reasons of domestic political stability. Meanwhile, Poland and Romania are discussing a similar move.
1) wiiw estimates. - 2) Current account data include transactions within the region (sum over individual countries). - 3) Forecasts estimated by wiiw. Source: wiiw, Eurostat. Forecasts by wiiw. Cut-off date for historical data and forecasts: 19 January 2022.
www.bne.eu
