
Page 42 - RUSRptOct18
P. 42
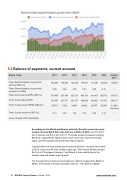
5.2  Balance of payments, current account
Russia -Trade 2011 2012 2013 2014 2015 2016 Jan-Nov 2017
Trade: External balance on goods and services (USD mn)
162,564 148,023 123,679 134,497 111,638 103,425 115,554
Trade: External balance on goods and services (% of GDP)
8.05 6.66 5.39 6.41 8.06 5.16 /
Trade: Goods exports (BoP) (USD mn)
515,409 527,434 523,275 497,763 341,467 285,772 319,712
Trade: Goods imports (BoP)
318,555 335,771 341,337 308,026 193,952 191,671 204,157
Trade: Current account BPM6 (USD mn)
97,274 71,282 34,801 58,432 68,375 25,664 21,466 (Jan-Sep)
Trade: Current account to GDP (%)
5.11 3.54 1.67 3.14 5.22 2.14 /
source: Rosstat, CEIC, World Bank
According to the official preliminary estimate, Russia's current account surplus reached $20.8 bln in the first two months of 2018,  up from $12.8 bln in January and $14.5 bln in 2m17. The trade surplus increased, reaching $29.6 bln, supported by higher exports than a year ago. Imports were also higher, but their growth was slower than that of exports.
Capital outflow from the private sector reached $9.8 bln in the first two months of 2018, versus the $4.4 bln outflow a year ago. The Finance Ministry bought $5.3 bln in FX between February 7 and March 6, also contributing to the weaker ruble and slower import growth.
The forecast of the current account balance in 2018 increased from $43bn to $59bn, the forecast of foreign exchange reserves - from $35bn to $50bn.
42  RUSSIA Country Report  October 2018    www.intellinews.com
