
Page 42 - RUSRptSept18
P. 42
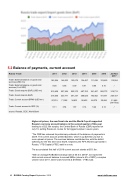
5.2  Balance of payments, current account
Russia -Trade 2011 2012 2013 2014 2015 2016 Jan-Nov 2017
Trade: External balance on goods and services (USD mn)
162,564 148,023 123,679 134,497 111,638 103,425 115,554
Trade: External balance on goods and services (% of GDP)
8.05 6.66 5.39 6.41 8.06 5.16 /
Trade: Goods exports (BoP) (USD mn)
515,409 527,434 523,275 497,763 341,467 285,772 319,712
Trade: Goods imports (BoP)
318,555 335,771 341,337 308,026 193,952 191,671 204,157
Trade: Current account BPM6 (USD mn)
97,274 71,282 34,801 58,432 68,375 25,664 21,466 (Jan-Sep)
Trade: Current account to GDP (%)
5.11 3.54 1.67 3.14 5.22 2.14 /
source: Rosstat, CEIC, World Bank
Higher oil prices, the new fiscal rule and the World Cup all supported Russia’s currency account balance in the second quarter of this year leading to a $22.3bn surplus, the Central Bank of Russia (CBR) reported on July 10, putting Russia on course for its biggest surplus in seven years.
“The CBR has released its preliminary estimate of the balance of payments in 2Q18. The current account printed $22.3bn, which is up $20.4bn y/y due to more upbeat oil prices. The services balance contributed too, with the deficit softening for the first time since 4Q16, helped by the FIFA World Cup hosted in Russia,” VTB Capital (VTBC) said in a note.
The accumulated first half of 2018 current account stands at $53.1bn.
“With an average RUBUSD exchange rate at 60.5 in 2018F, we expect the total current account balance to exceed $90bn (close to 6% of GDP), a surplus unseen since 2011, when Urals hovered at $109/bbl,” VTBC said.
42  RUSSIA Country Report  September 2018    www.intellinews.com
