
Page 45 - RusRPTDec20
P. 45
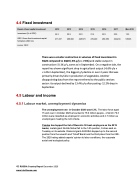
4.4 Fixed investment
Russia -Fixed capital investment 2012 2013 2014 2015 2016 2017 Mar-2018
Investment (% of GDP)
24.3 22.9 22.0 21.4 22.5 23.5 15.3
GDP: Gross fixed investment capital formation (USD mn)
471,337 496,982 428,573 276,240 280,350 342,294 58,303
source: CEIC
There was a smaller contraction in volumes of fixed investment in 3Q20 compared to 2Q20 (-6% y/y v -7.6%) and stable output in construction (-0.1% y/y, same as in September). On a negative side, the report has shown significant drop in agricultural output (-6.6% y/y v +1.4% in September), the biggest y/y decline in over 2 years that was primarily driven by falls in production of vegetables. Another disappointing data from the report referred to the public services sector: its output declined by 13.4% y/y after posting -12.2% drop in September.
4.5 Labour and income
4.5.1 Labour market, unemployment dynamics
The unemployment rate in October 2020 was 6.3%. The labor force aged 15 and over in October 2020 amounted to 75.0 million people , of which 70.3 million were classified as employed in economic activities and 4.7 million as unemployed, meeting the ILO criteria.
Yandex has topped the list of Russia’s 50 best employers as the 2019 leader, metals giant Norilsk Nickel fell to the 14th position, Forbes said on Tuesday on its website. Diamond giant ALROSA stepped up to the second position from the seventh and Tinkoff Bank took the third place from the 25th. The 2020 rating added experts’ opinion to labor conditions, the corporate social and ecological policy.
45 RUSSIA Country Report December 2020 www.intellinews.com
