
Page 50 - RusRPTAug21
P. 50
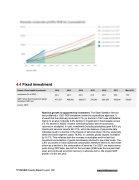
  4.4 Fixed investment
 Russia -Fixed capital investment 2012 2013 2014 2015 2016 2017 Mar-2018
 Investment (% of GDP)
24.3 22.9 22.0 21.4 22.5 23.5 15.3
 GDP: Gross fixed investment capital formation (USD mn)
471,337 496,982 428,573 276,240 280,350 342,294 58,303
 source: CEIC
    Russia’s growth is supported by investment. The State Statistics Service has published a 1Q21 GDP breakdown under the expenditure approach. It showed that the relatively moderate 0.7% y/y decline in 1Q21 was attributable mainly to an also moderate 0.4% decline in investment in fixed assets (versus a 2.1% decline in 4Q20). Another contributing factor was the post-crisis recovery in stockpiles. In total, investment (including stockpiles) grew 8.0% y/y. Goods and services imports fell 2.1%, which the balance of payments data indicates owed to a decline in the imports of services (down 32.4%), especially within the travel segment (down 76.5%). In contrast, goods imports increased by 15.7%. This reflected both the increase in stockpiles and the fact that household consumption of goods has already returned to pre-crisis levels. The 2.8% y/y decline in total household consumption therefore seems to have been driven by a decline in the consumption of services. For 2Q21, we expect some quite strong GDP data, due both to the low base (2Q20 was the low point last year) and continued economic recovery in absolute terms. We project GDP growth of 3.6% this year.
 50 RUSSIA Country Report August 2021 www.intellinews.com
