
Page 12 - BELRptNov18
P. 12
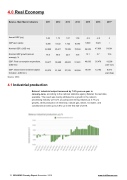
4.0   Real Economy
Belarus - Main Macro Indicators 2011 2012 2013 2014 2015 2016 2017*
Annual GDP (y/y)
5.54 1.73 1.07 1.59 -3.9 -2.8 2
GDP (per capita) 6,306 6,722 7,722 8,040 5,949 5,023 /
Nominal GDP, (USD mn) 62,929 65,611 75,389 78,594 56,503 47,836 54,381
Nominal GDP growth (annual 76.5 88.6 22.9 15.8 12.1 5.7 10.6 average), %
GDP: Final consumption expenditure, 39,417 39,698 48,603 51,961 (USD mn)
40,003
35,479
18,208 (Jan-Jun)
GDP: Gross fixed investment capital 22,372 21,342 27,376 26,004 formation, (USD mn)
16,091
12,192
8,873 (Jan-Sep)
Source: CEIC
4.1   Industrial production
Belarus' industrial output increased by 7.8% year-on-year in January-June,   according to the national statistics agency Belstat, the last data available. The result was mainly attributed to a growth in the nation's processing industry (a 10.2% y/y jump) and mining industry (a 3.7% y/y growth), while production of electricity, natural gas, steam, hot water, and conditioned air went up by 5.8% y/y in the first half of 2018.
12  BELARUS Country Report   November 2018    www.intellinews.com
