
Page 49 - RusRPTSept21
P. 49
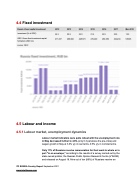
 4.4 Fixed investment
 Russia -Fixed capital investment 2012 2013 2014 2015 2016 2017 Mar-2018
 Investment (% of GDP)
24.3 22.9 22.0 21.4 22.5 23.5 15.3
 GDP: Gross fixed investment capital formation (USD mn)
471,337 496,982 428,573 276,240 280,350 342,294 58,303
 source: CEIC
      4.5 Labour and income
4.5.1 Labour market, unemployment dynamics
    Labour market indicators were quite robust with the unemployment rate in May decreased further to 4.8% (only 0.3 ppt above the pre-crisis) and wages’ growth in May at 3.3% y/y in real terms, 9.5% y/y in nominal terms.
Only 11% of Russians receive remuneration for their work in whole or in part "in an envelope,” according to the results of a survey carried out by the state owned pollster, the Russian Public Opinion Research Centre (VTsIOM) and released on August 18. Nine out of ten (86%) of Russians receive an
 49 RUSSIA Country Report September 2021 www.intellinews.com
