
Page 39 - RusRPTNov19
P. 39
than August, with sales up 0.7% y/y versus 0.8%. Both food and non-food sales slowed. Food sales rose 0.7% y/y in 3Q19, down from 1.6% y/y in 1H19, while 3Q non-food sales were up 1.0% y/y, versus 1.9% in 1H.
“One possible reason is the decelerating expansion in consumer loans (excluding mortgages), the growth of, which slowed to 22.9% y/y in August from 23.8% in June,” Sberbank added.
Economic growth in 3Q19 will likely be higher than in 2Q19, but just a bit.
Basic sector output rose 2.3% in July-August, accelerating from 1.7% in 2Q19, possibly indicating a pickup in GDP growth in 3Q19. In the coming months, we expect higher budget expenditures to push growth even higher (in particular in the construction sector and manufacturing of construction materials). Budget spending already rose in August (up 20% y/y), including on some infrastructure projects (such as roads and transportation). We note the risk, however, that some budgeted spending could be postponed until next year.
GDP expenditure breakdown for 2Q19 showed that household consumption remain the main driver of economic growth in Russia, while a turnaround in investment also contributed to GDP growth acceleration to 0.9% year-on-year seen in 2Q19 from 0.5% year-on-year in the first quarter, the latest data by Rosstat statistics agency shows. As reported by bne IntelliNews, as consumer demand remains depressed, investment through higher state spending is the main, albeit uncertain, hope for turnaround in growth in 2H19 and 2020. The continuing recovery in real disposable income should support household consumption, although a deceleration in retail lending, which is expected in 2H19 due to tightening regulations, could put some pressure on it, the bank believes.
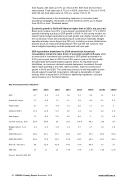
Key macroeconomic indicators "
2014 2015 2016 2017
2018 5M19
2.3 0.5 2.9 4.3 2.8 1.7 4.3 5.1 6.8 2 114.9 48.7 2.7 2.7
62.7 65.7 69.5 65.4 70.8 66.4 7.75 7.75
2019e 2020e
1.1 2.3 2.1 2.5 1.5 2 4.2 3.8 1.3 1.8 118 93 1.9 1.6
65.3 64.5 64.7 65.4 70 75 7.25 6.75
GDP
Industrial output
Retail trade
Inflation (EOP)
Real wages
Current account, $ bn
Budget deficit, % of GDP
RUB/USD (avr) RUB/USD (EOP) Brent $ / bbl (avr) CBR rate
Source: Rosstat, BCS GM
0.7 -2.5 -0.2 1.6 1.7 -0.8 1.3 2.1 2.7 -10 -4.6 1.3
11.4 12.9 5.4 2.5 1.3 -9.5 0.6 2.9 59.5 69.6 25 35.2 -0.4 -2.5 -3.4 -1.4
38.4 61.1 67.1 58.3 56.2 72.9 60.7 57.6 99 52.4 43.6 54.3 17 11 10 7.75
39 RUSSIA Country Report November 2019
www.intellinews.o
