
Page 30 - TURKRptOct19
P. 30
3.1 Macroeconomic overview
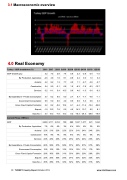
4.0 Real Economy
Turkey - GDP breakdown (%)
2016
2017
2018
Q1/18
Q2/18
Q3/18
Q4/18
Q1/19
Q2/19
GDP Growth (y/y)
3.2
7.5
2.8
7.4
5.6
2.3
-2.8
-2.4
-1.5
By Production -Agriculture
-2.6
4.9
1.9
8.1
-0.9
2.4
0.3
1.3
3.4
Industry
4.2
9.2
1.3
7.7
4.5
1.1
-6.7
-3.9
-2.7
Construction
5.4
9.0
-2.1
6.8
1.5
-6.3
-7.8
-9.3
-12.7
Services
0.2
11.1
5.4
10.5
9.0
4.6
-1.0
-3.4
-0.3
By Expenditure - Private Consumption
3.7
6.2
0.0
6.0
2.7
0.7
-7.7
-4.8
-1.1
Government Consumption
9.5
5.0
6.6
4.9
9.5
6.9
5.3
6.6
3.3
Gross Fixed Capital Formation
2.2
8.2
-0.6
10.4
6.1
-4.4
-11.6
-12.4
-22.8
Exports
-1.9
12.0
7.8
0.9
4.5
14.3
10.7
9.2
8.1
Imports (-)
3.7
10.3
-7.8
15.3
0.2
-16.3
-24.3
-28.9
-16.9
Current Prices (TRYbn)
GDP
2,609
3,111
3,724
790
890
1,027
1,017
921
1,024
By Production -Agriculture
7%
6%
6%
3%
4%
10%
6%
3%
5%
Industry
22%
21%
22%
22%
22%
21%
24%
24%
23%
Construction
10%
9%
7%
8%
8%
6%
6%
6%
5%
Services
24%
22%
23%
23%
23%
24%
24%
23%
24%
By Expenditure - Private Consumption
60%
59%
57%
58%
57%
55%
57%
57%
58%
Government Consumption
15%
15%
15%
15%
15%
13%
17%
17%
16%
Gross Fixed Capital Formation
29%
30%
30%
31%
33%
28%
29%
28%
25%
Exports
22%
25%
30%
25%
27%
33%
32%
32%
33%
Imports (-)
25%
29%
31%
32%
32%
30%
29%
31%
32%
30 TURKEY Country Report October 2019 www.intellinews.com
