
Page 7 - The phonological awarness_Neat
P. 7
American Journal of Education and Information Technology 2017; 1(1): 8-14 13
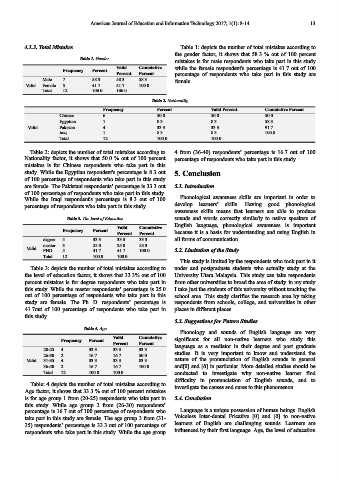
4.1.3. Total Mistakes Table 1: depicts the number of total mistakes according to
the gender factor, it shows that 58.3 % out of 100 percent
Table 1. Gender.
mistakes is for male respondents who take part in this study
Valid Cumulative while the female respondent's percentage is 41.7 out of 100
Frequency Percent
Percent Percent percentage of respondents who take part in this study are
Male 7 58.3 58.3 58.3 female.
Valid Female 5 41.7 41.7 100.0
Total 12 100.0 100.0
Table 2. Nationality.
Frequency Percent Valid Percent Cumulative Percent
Chinese 6 50.0 50.0 50.0
Egyptian 1 8.3 8.3 58.3
Valid Pakistan 4 33.3 33.3 91.7
Iraq 1 8.3 8.3 100.0
Total 12 100.0 100.0
Table 2: depicts the number of total mistakes according to 4 from (36-40) respondents’ percentage is 16.7 out of 100
Nationality factor, it shows that 50.0 % out of 100 percent percentage of respondents who take part in this study.
mistakes is for Chinese respondents who take part in this
study. While the Egyptian respondent's percentage is 8.3 out 5. Conclusion
of 100 percentage of respondents who take part in this study
are female. The Pakistani respondents’ percentage is 33.3 out 5.1. Introduction
of 100 percentage of respondents who take part in this study.
Phonological awareness skills are important in order to
While the Iraqi respondent's percentage is 8.3 out of 100
develop learners’ skills. Having good phonological
percentage of respondents who take part in this study.
awareness skills means that learners are able to produce
Table 3. The level of Education. sounds and words correctly similarly to native speakers of
English language, phonological awareness is important
Valid Cumulative
Frequency Percent because it is a basis for understanding and using English in
Percent Percent
degree 4 33.3 33.3 33.3 all forms of communication.
master 3 25.0 25.0 58.3
Valid
PHD 5 41.7 41.7 100.0 5.2. Limitation of the Study
Total 12 100.0 100.0
This study is limited by the respondents who took part in it
Table 3: depicts the number of total mistakes according to under and postgraduate students who actually study at the
the level of education factor, it shows that 33.3% out of 100 University Utara Malaysia. This study can take respondents
percent mistakes is for degree respondents who take part in from other universities to broad the area of study. in my study
this study. While the master respondents’ percentage is 25.0 I take just the students of this university without touching the
out of 100 percentage of respondents who take part in this school area. This study clarifies the research area by taking
study are female. The Ph. D. respondents’ percentage is respondents from schools, college, and universities in other
41.7out of 100 percentage of respondents who take part in places in different places.
this study.
5.3. Suggestions for Future Studies
Table 4. Age.
Phonology and sounds of English language are very
Valid Cumulative
Frequency Percent significant for all non-native learners who study this
Percent Percent
language as a mediator in their degree and post graduate
20-25 4 33.3 33.3 33.3
26-30 2 16.7 16.7 50.0 studies. It is very important to know and understand the
Valid 31-35 4 33.3 33.3 83.3 nature of the pronunciation of English sounds in general
36-40 2 16.7 16.7 100.0 and[θ] and [ð] in particular. More detailed studies should be
Total 12 100.0 100.0 conducted to investigate why non-native learner find
difficulty in pronunciation of English sounds, and to
Table: 4 depicts the number of total mistakes according to
investigate the causes and cures to this phenomenon.
Age factor, it shows that 33.3 % out of 100 percent mistakes
is for age group 1 from (20-25) respondents who take part in 5.4. Conclusion
this study. While age group 2 from (26-30) respondents’
percentage is 16.7 out of 100 percentage of respondents who Language is a unique possession of human beings. English
take part in this study are female. The age group 3 from (31- Voiceless Inter-dental Fricative [θ] and [ð] to non-native
35) respondents’ percentage is 33.3 out of 100 percentage of learners of English are challenging sounds. Learners are
respondents who take part in this study. While the age group influenced by their first language. Age, the level of education