
Page 32 - EXOSOMES
P. 32
Extracellular Vesicle Treatment for Glaucoma IOVS j February 2018 j Vol. 59 j No. 2 j 710
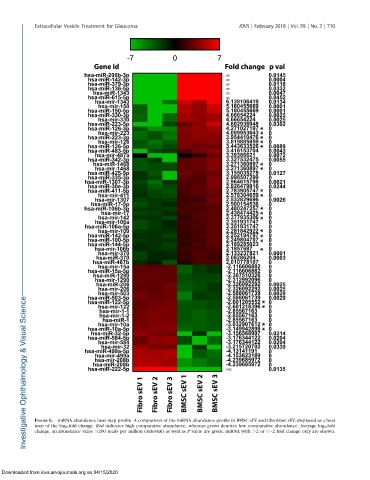
FIGURE 6. miRNA abundance heat map profile. A comparison of the miRNA abundance profile in BMSC sEV and fibroblast sEV, displayed as a heat
map of the log 2 -fold change. Red indicates high comparative abundance, whereas green denotes low comparative abundance. Average log 2 -fold
change, an abundance value >200 reads per million (Asterisk) as well as P value are given. miRNA with >2or < 2 fold change only are shown.
Downloaded from iovs.arvojournals.org on 04/15/2020