
Page 27 - Noble's TMT Consumer Virtual Equity Conference 2024
P. 27
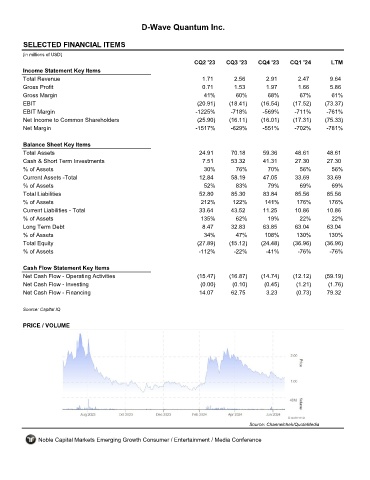
D-Wave Quantum Inc.


         SELECTED FINANCIAL ITEMS                                 QBTS
         (in millions of USD)
                                                                     CQ2 '23    CQ3 '23    CQ4 '23    CQ1 '24       LTM
         Income Statement Key Items
         Total Revenue                                                 1.71        2.56       2.91       2.47       9.64
         Gross Profit                                                  0.71        1.53       1.97       1.66       5.86
         Gross Margin                                                   41%        60%        68%        67%        61%
         EBIT                                                         (20.91)    (18.41)    (16.54)    (17.52)    (73.37)
         EBIT Margin                                                 -1225%      -718%      -569%       -711%      -761%
         Net Income to Common Shareholders                            (25.90)    (16.11)    (16.01)    (17.31)    (75.33)
         Net Margin                                                  -1517%      -629%      -551%       -702%      -781%

         Balance Sheet Key Items
         Total Assets                                                 24.91      70.18       59.36      48.61      48.61
         Cash & Short Term Investments                                 7.51      53.32       41.31      27.30      27.30
         % of Assets                                                    30%        76%        70%        56%         56%
         Current Assets -Total                                        12.84      58.19       47.05      33.69      33.69
         % of Assets                                                    52%        83%        79%        69%         69%
         Total Liabilities                                            52.80       85.30      83.84      85.56      85.56
         % of Assets                                                   212%       122%       141%       176%       176%
         Current Liabilities - Total                                  33.64      43.52       11.25      10.86      10.86
         % of Assets                                                   135%        62%        19%        22%        22%
         Long Term Debt                                                8.47      32.83       63.85      63.04      63.04
         % of Assets                                                    34%        47%       108%       130%       130%
         Total Equity                                                 (27.89)    (15.12)    (24.48)    (36.96)    (36.96)
         % of Assets                                                  -112%       -22%        -41%       -76%       -76%

         Cash Flow Statement Key Items
         Net Cash Flow - Operating Activities                         (15.47)    (16.87)    (14.74)    (12.12)    (59.19)
         Net Cash Flow - Investing                                     (0.00)     (0.10)     (0.45)     (1.21)     (1.76)
         Net Cash Flow - Financing                                    14.07      62.75        3.23      (0.73)     79.32

         Source: Capital IQ


         PRICE / VOLUME


                                                                                        Source: Channelchek/QuoteMedia

              Noble Capital Markets Emerging Growth Consumer / Entertainment / Media Conference