Page 53 - Noble's TMT Consumer Virtual Equity Conference 2024
P. 53

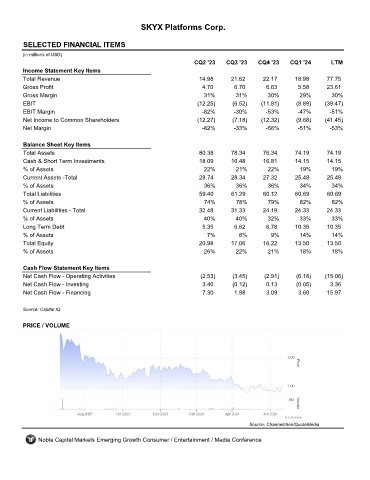
SKYX Platforms Corp.


         SELECTED FINANCIAL ITEMS                                 SKYX
         (in millions of USD)
                                                                     CQ2 '23    CQ3 '23    CQ4 '23    CQ1 '24       LTM
         Income Statement Key Items
         Total Revenue                                                14.98      21.62       22.17      18.98      77.75
         Gross Profit                                                  4.70        6.70       6.63       5.58      23.61
         Gross Margin                                                   31%        31%        30%        29%        30%
         EBIT                                                         (12.25)     (6.52)    (11.81)     (8.89)    (39.47)
         EBIT Margin                                                   -82%       -30%        -53%       -47%       -51%
         Net Income to Common Shareholders                            (12.27)     (7.18)    (12.32)     (9.68)    (41.45)
         Net Margin                                                    -82%       -33%        -56%       -51%       -53%

         Balance Sheet Key Items
         Total Assets                                                 80.38      78.34       76.34      74.19      74.19
         Cash & Short Term Investments                                18.09      16.48       16.81      14.15      14.15
         % of Assets                                                    22%        21%        22%        19%         19%
         Current Assets -Total                                        28.74      28.34       27.32      25.48      25.48
         % of Assets                                                    36%        36%        36%        34%         34%
         Total Liabilities                                            59.40       61.29      60.12      60.69      60.69
         % of Assets                                                    74%        78%        79%        82%         82%
         Current Liabilities - Total                                  32.48      31.33       24.19      24.33      24.33
         % of Assets                                                    40%        40%        32%        33%        33%
         Long Term Debt                                                5.35        6.62       6.78      10.35      10.35
         % of Assets                                                     7%         8%         9%        14%        14%
         Total Equity                                                 20.98      17.06       16.22      13.50      13.50
         % of Assets                                                    26%        22%        21%        18%        18%

         Cash Flow Statement Key Items
         Net Cash Flow - Operating Activities                          (2.53)     (3.45)     (2.91)     (6.18)    (15.06)
         Net Cash Flow - Investing                                     3.40       (0.12)      0.13      (0.05)      3.36
         Net Cash Flow - Financing                                     7.30        1.98       3.09       3.60      15.97

         Source: Capital IQ


         PRICE / VOLUME


                                                                                        Source: Channelchek/QuoteMedia

              Noble Capital Markets Emerging Growth Consumer / Entertainment / Media Conference
   48   49   50   51   52   53   54   55   56   57   58