
Page 59 - Noble's TMT Consumer Virtual Equity Conference 2024
P. 59
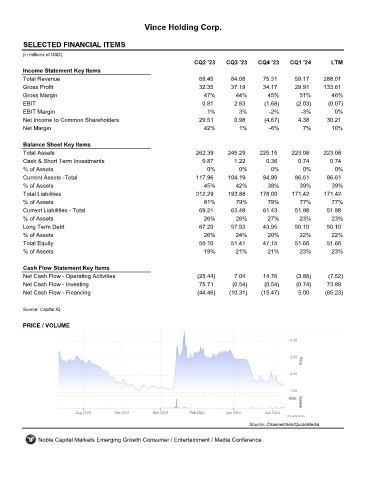
Vince Holding Corp.


         SELECTED FINANCIAL ITEMS                                 VNCE
         (in millions of USD)
                                                                     CQ2 '23    CQ3 '23    CQ4 '23    CQ1 '24       LTM
         Income Statement Key Items
         Total Revenue                                                69.45      84.08       75.31      59.17     288.01
         Gross Profit                                                 32.35      37.19       34.17      29.91     133.61
         Gross Margin                                                   47%        44%        45%        51%        46%
         EBIT                                                          0.81        2.83      (1.68)     (2.03)     (0.07)
         EBIT Margin                                                     1%         3%         -2%        -3%         0%
         Net Income to Common Shareholders                            29.51        0.98      (4.67)      4.38      30.21
         Net Margin                                                     42%         1%         -6%        7%         10%

         Balance Sheet Key Items
         Total Assets                                                262.39     245.29     225.15      223.08     223.08
         Cash & Short Term Investments                                 0.87        1.22       0.36       0.74       0.74
         % of Assets                                                     0%         0%         0%          0%         0%
         Current Assets -Total                                       117.96     104.19       84.80      86.61      86.61
         % of Assets                                                    45%        42%        38%        39%         39%
         Total Liabilities                                           212.29     193.88      178.00     171.42     171.42
         % of Assets                                                    81%        79%        79%        77%         77%
         Current Liabilities - Total                                  69.21      63.48       61.43      51.98      51.98
         % of Assets                                                    26%        26%        27%        23%        23%
         Long Term Debt                                               67.20      57.93       43.95      50.10      50.10
         % of Assets                                                    26%        24%        20%        22%        22%
         Total Equity                                                 50.10      51.41       47.15      51.66      51.66
         % of Assets                                                    19%        21%        21%        23%        23%

         Cash Flow Statement Key Items
         Net Cash Flow - Operating Activities                         (25.44)      7.04      14.76      (3.88)     (7.52)
         Net Cash Flow - Investing                                    75.71       (0.54)     (0.54)     (0.74)     73.89
         Net Cash Flow - Financing                                    (44.46)    (10.31)    (15.47)      5.00     (65.23)

         Source: Capital IQ


         PRICE / VOLUME


                                                                                        Source: Channelchek/QuoteMedia

              Noble Capital Markets Emerging Growth Consumer / Entertainment / Media Conference