
Page 41 - C:\Users\Chris Patches\My ShareSync\Virtual Events\2024 - TMT Consumer\Book\Flip Output\
P. 41
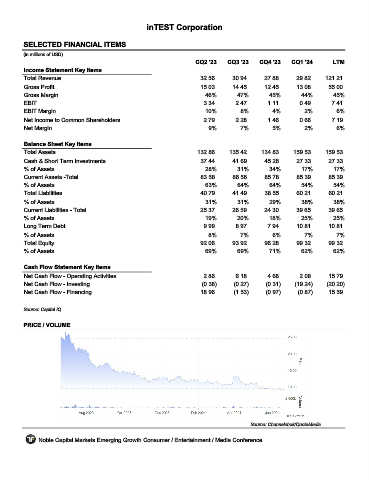
inTEST Corporation


         SELECTED FINANCIAL ITEMS                                 INTT
         (in millions of USD)
                                                                     CQ2 '23    CQ3 '23    CQ4 '23    CQ1 '24       LTM
         Income Statement Key Items
         Total Revenue                                                32.56      30.94       27.88      29.82     121.21
         Gross Profit                                                 15.03      14.45       12.45      13.08      55.00
         Gross Margin                                                   46%        47%        45%        44%        45%
         EBIT                                                          3.34        2.47       1.11       0.49       7.41
         EBIT Margin                                                    10%         8%         4%         2%          6%
         Net Income to Common Shareholders                             2.79        2.28       1.46       0.66       7.19
         Net Margin                                                      9%         7%         5%         2%          6%

         Balance Sheet Key Items
         Total Assets                                                132.86     135.42     134.83      159.53     159.53
         Cash & Short Term Investments                                37.44      41.69       45.26      27.33      27.33
         % of Assets                                                    28%        31%        34%        17%         17%
         Current Assets -Total                                        83.58       86.56      85.78      85.39      85.39
         % of Assets                                                    63%        64%        64%        54%         54%
         Total Liabilities                                            40.79       41.49      38.55      60.21      60.21
         % of Assets                                                    31%        31%        29%        38%         38%
         Current Liabilities - Total                                  25.37      26.59       24.30      39.65      39.65
         % of Assets                                                    19%        20%        18%        25%        25%
         Long Term Debt                                                9.99        8.97       7.94      10.81      10.81
         % of Assets                                                     8%         7%         6%         7%          7%
         Total Equity                                                 92.06      93.92       96.28      99.32      99.32
         % of Assets                                                    69%        69%        71%        62%        62%

         Cash Flow Statement Key Items
         Net Cash Flow - Operating Activities                          2.86        6.18       4.68       2.08      15.79
         Net Cash Flow - Investing                                     (0.38)     (0.27)     (0.31)    (19.24)    (20.20)
         Net Cash Flow - Financing                                    18.96       (1.53)     (0.97)     (0.87)     15.59

         Source: Capital IQ


         PRICE / VOLUME


                                                                                        Source: Channelchek/QuoteMedia

              Noble Capital Markets Emerging Growth Consumer / Entertainment / Media Conference