Page 147 - NobleCon21
P. 147

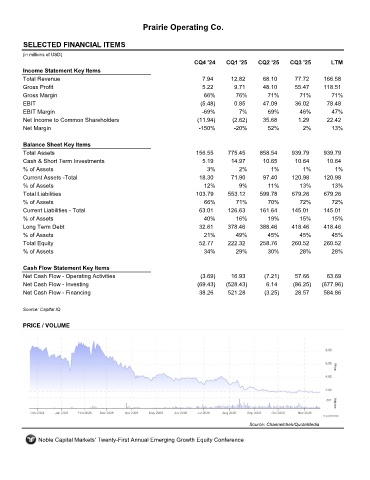
Prairie Operating Co.


         SELECTED FINANCIAL ITEMS                                 PROP
         (in millions of USD)
                                                                     CQ4 '24    CQ1 '25    CQ2 '25    CQ3 '25       LTM
         Income Statement Key Items
         Total Revenue                                                 7.94      12.82       68.10      77.72     166.58
         Gross Profit                                                  5.22        9.71      48.10      55.47     118.51
         Gross Margin                                                   66%        76%        71%        71%        71%
         EBIT                                                          (5.48)      0.85      47.09      36.02      78.48
         EBIT Margin                                                   -69%         7%        69%        46%        47%
         Net Income to Common Shareholders                            (11.94)     (2.62)     35.68       1.29      22.42
         Net Margin                                                   -150%       -20%        52%         2%        13%

         Balance Sheet Key Items
         Total Assets                                                156.55     775.45     858.54      939.79     939.79
         Cash & Short Term Investments                                 5.19      14.97       10.65      10.64      10.64
         % of Assets                                                     3%         2%         1%          1%         1%
         Current Assets -Total                                        18.30      71.90       97.40     120.98     120.98
         % of Assets                                                    12%         9%        11%        13%         13%
         Total Liabilities                                           103.79     553.12      599.78     679.26     679.26
         % of Assets                                                    66%        71%        70%        72%         72%
         Current Liabilities - Total                                  63.01     126.63     161.64      145.01     145.01
         % of Assets                                                    40%        16%        19%        15%        15%
         Long Term Debt                                               32.61     378.46     388.46      418.46     418.46
         % of Assets                                                    21%        49%        45%        45%        45%
         Total Equity                                                 52.77     222.32     258.76      260.52     260.52
         % of Assets                                                    34%        29%        30%        28%        28%

         Cash Flow Statement Key Items
         Net Cash Flow - Operating Activities                          (3.69)    16.93       (7.21)     57.66      63.69
         Net Cash Flow - Investing                                    (69.43)   (528.43)      6.14     (86.25)   (677.96)
         Net Cash Flow - Financing                                    38.26     521.28       (3.25)     28.57     584.86

         Source: Capital IQ


         PRICE / VOLUME


                                                                                        Source: Channelchek/QuoteMedia

              Noble Capital Markets' Twenty-First Annual Emerging Growth Equity Conference
   142   143   144   145   146   147   148   149   150   151   152