
Page 69 - NobleCon21
P. 69
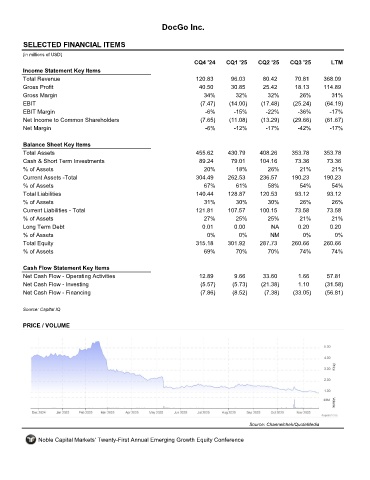
DocGo Inc.


         SELECTED FINANCIAL ITEMS                                 DCGO
         (in millions of USD)
                                                                     CQ4 '24    CQ1 '25    CQ2 '25    CQ3 '25       LTM
         Income Statement Key Items
         Total Revenue                                               120.83      96.03       80.42      70.81     368.09
         Gross Profit                                                 40.50      30.85       25.42      18.13     114.89
         Gross Margin                                                   34%        32%        32%        26%        31%
         EBIT                                                          (7.47)    (14.00)    (17.48)    (25.24)    (64.19)
         EBIT Margin                                                    -6%       -15%        -22%       -36%       -17%
         Net Income to Common Shareholders                             (7.65)    (11.08)    (13.29)    (29.66)    (61.67)
         Net Margin                                                     -6%       -12%        -17%       -42%       -17%

         Balance Sheet Key Items
         Total Assets                                                455.62     430.79     408.26      353.78     353.78
         Cash & Short Term Investments                                89.24      79.01     104.16       73.36      73.36
         % of Assets                                                    20%        18%        26%        21%         21%
         Current Assets -Total                                       304.49     262.53      236.57     190.23     190.23
         % of Assets                                                    67%        61%        58%        54%         54%
         Total Liabilities                                           140.44     128.87      120.53      93.12      93.12
         % of Assets                                                    31%        30%        30%        26%         26%
         Current Liabilities - Total                                 121.81     107.57     100.15       73.58      73.58
         % of Assets                                                    27%        25%        25%        21%        21%
         Long Term Debt                                                0.01        0.00        NA        0.20       0.20
         % of Assets                                                     0%         0%         NM         0%          0%
         Total Equity                                                315.18     301.92     287.73      260.66     260.66
         % of Assets                                                    69%        70%        70%        74%        74%

         Cash Flow Statement Key Items
         Net Cash Flow - Operating Activities                         12.89        9.66      33.60       1.66      57.81
         Net Cash Flow - Investing                                     (5.57)     (5.73)    (21.38)      1.10     (31.58)
         Net Cash Flow - Financing                                     (7.86)     (8.52)     (7.38)    (33.05)    (56.81)

         Source: Capital IQ


         PRICE / VOLUME


                                                                                        Source: Channelchek/QuoteMedia

              Noble Capital Markets' Twenty-First Annual Emerging Growth Equity Conference