
Page 83 - NobleCon21
P. 83
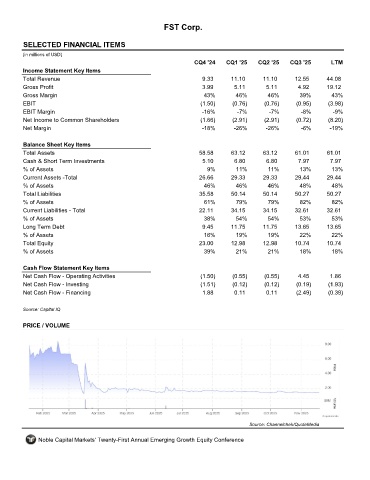
FST Corp.


         SELECTED FINANCIAL ITEMS                                 KBSX
         (in millions of USD)
                                                                     CQ4 '24    CQ1 '25    CQ2 '25    CQ3 '25       LTM
         Income Statement Key Items
         Total Revenue                                                 9.33      11.10       11.10      12.55      44.08
         Gross Profit                                                  3.99        5.11       5.11       4.92      19.12
         Gross Margin                                                   43%        46%        46%        39%        43%
         EBIT                                                          (1.50)     (0.76)     (0.76)     (0.95)     (3.98)
         EBIT Margin                                                   -16%         -7%        -7%        -8%        -9%
         Net Income to Common Shareholders                             (1.66)     (2.91)     (2.91)     (0.72)     (8.20)
         Net Margin                                                    -18%       -26%        -26%        -6%       -19%

         Balance Sheet Key Items
         Total Assets                                                 58.58      63.12       63.12      61.01      61.01
         Cash & Short Term Investments                                 5.10        6.80       6.80       7.97       7.97
         % of Assets                                                     9%        11%        11%        13%         13%
         Current Assets -Total                                        26.66      29.33       29.33      29.44      29.44
         % of Assets                                                    46%        46%        46%        48%         48%
         Total Liabilities                                            35.58       50.14      50.14      50.27      50.27
         % of Assets                                                    61%        79%        79%        82%         82%
         Current Liabilities - Total                                  22.11      34.15       34.15      32.61      32.61
         % of Assets                                                    38%        54%        54%        53%        53%
         Long Term Debt                                                9.45      11.75       11.75      13.65      13.65
         % of Assets                                                    16%        19%        19%        22%        22%
         Total Equity                                                 23.00      12.98       12.98      10.74      10.74
         % of Assets                                                    39%        21%        21%        18%        18%

         Cash Flow Statement Key Items
         Net Cash Flow - Operating Activities                          (1.50)     (0.55)     (0.55)      4.45       1.86
         Net Cash Flow - Investing                                     (1.51)     (0.12)     (0.12)     (0.19)     (1.93)
         Net Cash Flow - Financing                                     1.88        0.11       0.11      (2.49)     (0.39)

         Source: Capital IQ


         PRICE / VOLUME


                                                                                        Source: Channelchek/QuoteMedia

              Noble Capital Markets' Twenty-First Annual Emerging Growth Equity Conference