
Page 121 - NobleCon20-Book-Project
P. 121
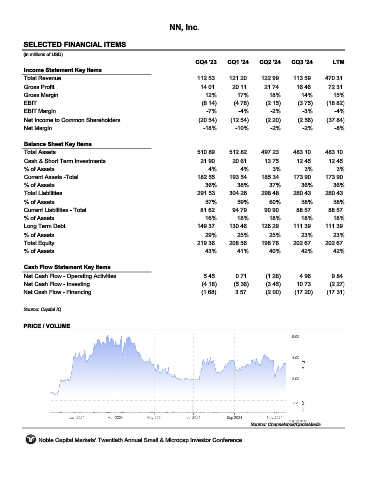
NN, Inc.


       SELECTED FINANCIAL ITEMS                                NNBR

      (in millions of USD)
                                                                  CQ4 '23    CQ1 '24    CQ2 '24    CQ3 '24        LTM
       Income Statement Key Items
       Total Revenue                                               112.53     121.20     122.99     113.59     470.31
       Gross Profit                                                 14.01      20.11      21.74      16.46      72.31
       Gross Margin                                                  12%         17%        18%        14%        15%
       EBIT                                                         (8.14)     (4.78)      (2.15)     (3.75)    (18.82)
       EBIT Margin                                                    -7%        -4%        -2%        -3%        -4%
       Net Income to Common Shareholders                           (20.54)    (12.54)      (2.20)     (2.56)    (37.84)
       Net Margin                                                    -18%       -10%        -2%        -2%        -8%


       Balance Sheet Key Items
       Total Assets                                                510.89     512.82     497.23     483.10     483.10
       Cash & Short Term Investments                                21.90      20.61      13.75      12.45      12.45
       % of Assets                                                     4%         4%         3%         3%         3%
       Current Assets -Total                                       182.55     193.54     185.34     173.90     173.90
       % of Assets                                                    36%        38%        37%        36%        36%
       Total Liabilities                                           291.53     304.26     298.48     280.43     280.43
       % of Assets                                                    57%        59%        60%        58%        58%
       Current Liabilities - Total                                  81.62      94.79      90.90      88.57      88.57
       % of Assets                                                   16%         18%        18%        18%        18%
       Long Term Debt                                              149.37     130.46     126.29     111.39     111.39
       % of Assets                                                   29%         25%        25%        23%        23%
       Total Equity                                                219.36     208.56     198.76     202.67     202.67
       % of Assets                                                    43%        41%        40%        42%        42%


       Cash Flow Statement Key Items
       Net Cash Flow - Operating Activities                          5.45       0.71       (1.28)     4.96       9.84
       Net Cash Flow - Investing                                    (4.18)     (5.36)      (3.45)    10.73       (2.27)
       Net Cash Flow - Financing                                    (1.68)      3.57       (2.00)    (17.20)    (17.31)


      Source: Capital IQ

       PRICE / VOLUME


                                                                                     Source: Channelchek/QuoteMedia

            Noble Capital Markets' Twentieth Annual Small & Microcap Investor Conference