
Page 99 - NobleCon20-Book-Project
P. 99
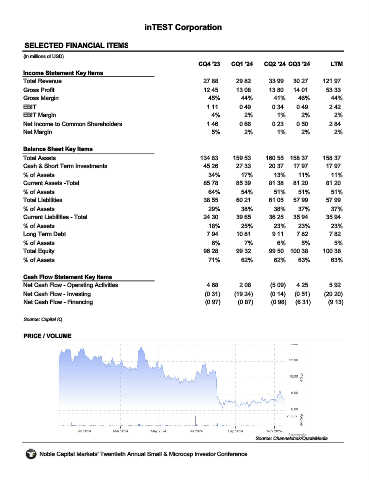
inTEST Corporation


      SELECTED FINANCIAL ITEMS                                 INTT

      (in millions of USD)
                                                                  CQ4 '23    CQ1 '24    CQ2 '24 CQ3 '24        LTM
      Income Statement Key Items
      Total Revenue                                                 27.88      29.82      33.99   30.27     121.97
      Gross Profit                                                  12.45      13.08      13.80   14.01      53.33
      Gross Margin                                                   45%         44%        41%     46%        44%
      EBIT                                                           1.11       0.49       0.34    0.49        2.42
      EBIT Margin                                                      4%         2%         1%      2%         2%
      Net Income to Common Shareholders                              1.46       0.66       0.23    0.50        2.84
      Net Margin                                                       5%         2%         1%      2%         2%

      Balance Sheet Key Items
      Total Assets                                                 134.83     159.53     160.55  158.37     158.37
      Cash & Short Term Investments                                 45.26      27.33      20.37   17.97      17.97
      % of Assets                                                    34%         17%        13%     11%        11%
      Current Assets -Total                                         85.78      85.39      81.38   81.20      81.20
      % of Assets                                                    64%         54%        51%     51%        51%
      Total Liabilities                                             38.55      60.21      61.05   57.99      57.99
      % of Assets                                                    29%         38%        38%     37%        37%
      Current Liabilities - Total                                   24.30      39.65      36.25   35.94      35.94
      % of Assets                                                    18%         25%        23%     23%        23%
      Long Term Debt                                                 7.94      10.81       9.11    7.82        7.82
      % of Assets                                                      6%         7%         6%      5%         5%
      Total Equity                                                  96.28      99.32      99.50  100.38     100.38
      % of Assets                                                    71%         62%        62%     63%        63%

      Cash Flow Statement Key Items
      Net Cash Flow - Operating Activities                           4.68       2.08      (5.09)   4.25        5.92
      Net Cash Flow - Investing                                     (0.31)    (19.24)     (0.14)   (0.51)    (20.20)
      Net Cash Flow - Financing                                     (0.97)     (0.87)     (0.98)   (6.31)     (9.13)


      Source: Capital IQ

      PRICE / VOLUME


                                                                                     Source: Channelchek/QuoteMedia

            Noble Capital Markets' Twentieth Annual Small & Microcap Investor Conference