Page 283 - IT_Bulletin
P. 283
S. No.
Activity No.
Activity
description
Activity
Duration
Start date
Finish date
Responsible
member
Pre-requisite
information
or
kRnesoowulrecdegse
required
Estimated
expenditure
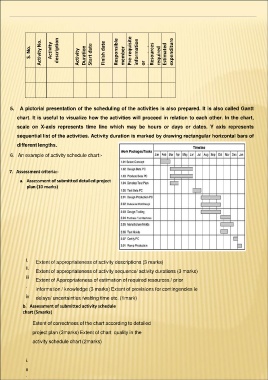
5. A pictorial presentation of the scheduling of the activities is also prepared. It is also called Gantt
chart. It is useful to visualize how the activities will proceed in relation to each other. In the chart,
scale on X-axis represents time line which may be hours or days or dates. Y axis represents
sequential list of the activities. Activity duration is marked by drawing rectangular horizontal bars of
different lengths.
6. An example of activity schedule chart:-
7. Assessment criteria:-
a. Assessment of submitted detailed project
plan (10 marks)
i. Extent of appropriateness of activity descriptions (3 marks)
ii. Extent of appropriateness of activity sequence/ activity durations (3 marks)
iii Extent of Appropriateness of estimation of required resources / prior
. information / knowledge (3 marks) Extent of provisions for contingencies ie
iv delays/ uncertainties /waiting time etc. (1mark)
.
b. Assessment of submitted activity schedule
chart (5marks)
Extent of correctness of the chart according to detailed
project plan (3marks) Extent of chart quality in the
activity schedule chart (2marks)
i.
ii
.
Activity No.
Activity
description
Activity
Duration
Start date
Finish date
Responsible
member
Pre-requisite
information
or
kRnesoowulrecdegse
required
Estimated
expenditure
5. A pictorial presentation of the scheduling of the activities is also prepared. It is also called Gantt
chart. It is useful to visualize how the activities will proceed in relation to each other. In the chart,
scale on X-axis represents time line which may be hours or days or dates. Y axis represents
sequential list of the activities. Activity duration is marked by drawing rectangular horizontal bars of
different lengths.
6. An example of activity schedule chart:-
7. Assessment criteria:-
a. Assessment of submitted detailed project
plan (10 marks)
i. Extent of appropriateness of activity descriptions (3 marks)
ii. Extent of appropriateness of activity sequence/ activity durations (3 marks)
iii Extent of Appropriateness of estimation of required resources / prior
. information / knowledge (3 marks) Extent of provisions for contingencies ie
iv delays/ uncertainties /waiting time etc. (1mark)
.
b. Assessment of submitted activity schedule
chart (5marks)
Extent of correctness of the chart according to detailed
project plan (3marks) Extent of chart quality in the
activity schedule chart (2marks)
i.
ii
.