Page 16 - PowerPoint Presentation
P. 16

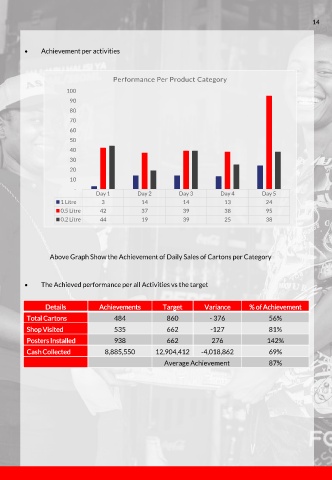
    Achievement per activities


                                      Performance Per Product Category

                       100
                        90
                        80
                        70
                        60
                        50
                        40
                        30
                        20
                        10
                          -
                                Day 1         Day 2        Day 3         Day 4        Day 5
                     1 Litre      3            14            14           13            24
                     0.5 Litre    42           37            39           38            95
                     0.2 Litre    44           19            39           25            38


                 Above Graph Show the Achievement of Daily Sales of Cartons per Category


             The Achieved performance per all Activities vs the target


                Details          Achievements         Target        Variance      % of Achievement
          Total Cartons               484              860           - 376               56%
          Shop Visited                535              662           -127                81%
          Posters Installed           938              662            276               142%

          Cash Collected           8,885,550        12,904,412    -4,018,862             69%
                                                      Average Achievement                87%
   11   12   13   14   15   16   17   18   19   20   21