Page 22 - PowerPoint Presentation
P. 22

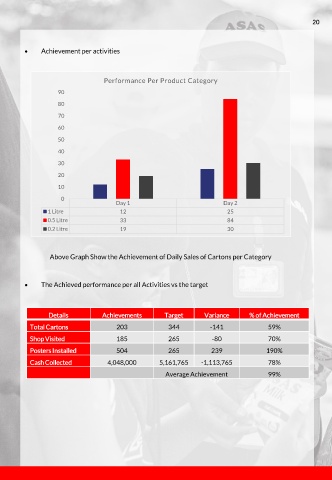
    Achievement per activities


                                   Performance Per Product Category
                    90
                    80

                    70
                    60

                    50
                    40
                    30

                    20
                    10

                     0
                                       Day 1                              Day 2
                 1 Litre                12                                 25
                 0.5 Litre              33                                 84
                 0.2 Litre              19                                 30


                 Above Graph Show the Achievement of Daily Sales of Cartons per Category


             The Achieved performance per all Activities vs the target


                 Details          Achievements         Target       Variance      % of Achievement

           Total Cartons               203              344          -141               59%
           Shop Visited                185              265           -80               70%
           Posters Installed           504              265           239               190%

           Cash Collected           4,048,000        5,161,765    -1,113,765            78%
                                                       Average Achievement              99%
   17   18   19   20   21   22   23   24   25   26   27