
Page 28 - Final Approved 2017-2018 Student Accommodation Plan 2017-03-29
P. 28
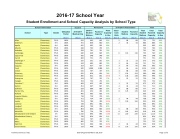
2016-17 School Year
Student Enrollment and School Capacity Analysis by School Type
School Information
Student
Permanent
2016-2017 Relocatables
Total
School
Type
Grades
Utilization Factor
(Note 1)
2016-2017 Membership
(Note 2)
2016-17 Student Stations (Note 3)
Factored Capacity
(Note 4)
Perm Capacity In Use (Note 5)
Class- room Units (Note 6)
Student Stations
(Note 7)
Factored Capacity
(Note 8)
Total Student Stations (Note 9)
Total Factored Capacity (Note 9)
Total Capacity In Use (Note 9)
Allen
Elementary
PK-6
100%
632
663
663
95%
5
88
88
751
751
84%
Andersen
Elementary
K-6
100%
701
840
840
84%
2
44
44
884
884
79%
Apollo
Elementary
K-6
100%
815
902
902
90%
902
902
90%
Atlantis
Elementary
PK-6
100%
648
703
703
92%
703
703
92%
Audubon
Elementary
PK-6
100%
599
761
761
79%
761
761
79%
Cambridge
Elementary
PK-6
100%
640
649
649
99%
6
116
116
765
765
84%
Cape View
Elementary
PK-6
100%
426
548
548
78%
548
548
78%
Carroll
Elementary
K-6
100%
660
751
751
88%
751
751
88%
Challenger 7
Elementary
PK-6
100%
525
551
551
95%
1
22
22
573
573
92%
Columbia
Elementary
PK-6
100%
544
685
685
79%
3
66
66
751
751
72%
Coquina
Elementary
K-6
100%
523
627
627
83%
3
66
66
693
693
76%
Creel
Elementary
PK-6
100%
940
1,088
1,088
86%
3
66
66
1,154
1,154
82%
Croton
Elementary
PK-6
100%
615
707
707
87%
4
88
88
795
795
77%
Discovery
Elementary
PK-6
100%
625
826
826
76%
7
154
154
980
980
64%
Endeavour
Elementary
PK-6
100%
890
852
852
105%
7
138
138
990
990
90%
Enterprise
Elementary
K-6
100%
543
707
707
77%
1
22
22
729
729
75%
Fairglen
Elementary
PK-6
100%
703
753
753
93%
753
753
93%
Freedom 7
Elementary
K-6
100%
409
453
453
90%
1
22
22
475
475
86%
Gemini
Elementary
K-6
100%
451
667
667
68%
2
44
44
711
711
63%
Golfview
Elementary
PK-6
100%
619
689
689
90%
4
88
88
777
777
80%
Harbor City
Elementary
PK-6
100%
401
453
453
89%
8
176
176
629
629
64%
Holland
Elementary
PK-6
100%
466
605
605
77%
605
605
77%
Imperial Estates
Elementary
K-6
100%
718
729
729
99%
729
729
99%
Indialantic
Elementary
K-6
100%
751
754
754
100%
2
44
44
798
798
94%
Jupiter
Elementary
PK-6
100%
793
780
780
102%
7
150
150
930
930
85%
Lockmar
Elementary
PK-6
100%
728
892
892
82%
892
892
82%
Longleaf
Elementary
PK-6
100%
683
790
790
87%
790
790
87%
Manatee
Elementary
K-6
100%
864
866
866
100%
5
88
88
954
954
91%
McAuliffe
Elementary
PK-6
100%
786
754
754
104%
8
164
164
918
918
86%
Meadowlane Intermediate
Elementary
3-6
100%
1,010
894
894
113%
11
220
220
1,114
1,114
91%
Meadowlane Primary
Elementary
K-6
100%
748
824
824
91%
824
824
91%
Mila
Elementary
PK-6
100%
534
707
707
76%
707
707
76%
Mims
Elementary
PK-6
100%
485
725
725
67%
725
725
67%
Oak Park
Elementary
PK-6
100%
922
906
906
102%
2
44
44
950
950
97%
Ocean Breeze
Elementary
PK-6
100%
519
498
498
104%
8
156
156
654
654
79%
Facilities Services / DGL Board Approved March 28, 2017 Page 1 of 3
