
Page 29 - Final Approved 2017-2018 Student Accommodation Plan 2017-03-29
P. 29
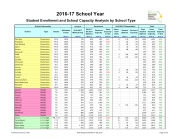
2016-17 School Year
Student Enrollment and School Capacity Analysis by School Type
School Information
Student
Permanent
2016-2017 Relocatables
Total
School
Type
Grades
Utilization Factor
(Note 1)
2016-2017 Membership
(Note 2)
2016-17 Student Stations (Note 3)
Factored Capacity
(Note 4)
Perm Capacity In Use (Note 5)
Class- room Units (Note 6)
Student Stations
(Note 7)
Factored Capacity
(Note 8)
Total Student Stations (Note 9)
Total Factored Capacity (Note 9)
Total Capacity In Use (Note 9)
Palm Bay
Elementary
PK-6
100%
799
829
829
96%
8
176
176
1,005
1,005
80%
Pinewood
Elementary
PK-6
100%
530
485
485
109%
3
66
66
551
551
96%
Port Malabar
Elementary
PK-6
100%
741
768
768
97%
4
84
84
852
852
87%
Quest
Elementary
PK-6
100%
900
910
910
99%
3
40
40
950
950
95%
Riviera
Elementary
PK-6
100%
647
689
689
94%
4
88
88
777
777
83%
Roosevelt
Elementary
K-6
100%
359
599
599
60%
599
599
60%
Sabal
Elementary
PK-6
100%
550
679
679
81%
5
106
106
785
785
70%
Saturn
Elementary
PK-6
100%
763
848
848
90%
6
128
128
976
976
78%
Sea Park
Elementary
PK-6
100%
339
461
461
74%
461
461
74%
Sherwood
Elementary
PK-6
100%
485
609
609
80%
609
609
80%
Stevenson
Elementary
K-6
100%
484
569
569
85%
569
569
85%
Sunrise
Elementary
PK-6
100%
841
895
895
94%
895
895
94%
Suntree
Elementary
K-6
100%
657
689
689
95%
3
66
66
755
755
87%
Surfside
Elementary
K-6
100%
475
439
439
108%
4
84
84
523
523
91%
Tropical
Elementary
K-6
100%
787
910
910
87%
910
910
87%
Turner
Elementary
PK-6
100%
631
830
830
76%
2
44
44
874
874
72%
University Park
Elementary
PK-6
100%
546
679
679
80%
6
132
132
811
811
67%
West Melbourne
Elementary
K-6
100%
550
618
618
89%
618
618
89%
Westside
Elementary
K-6
100%
712
835
835
85%
1
22
22
857
857
83%
Williams
Elementary
PK-6
100%
581
627
627
93%
4
88
88
715
715
81%
Central
Middle
7-8
90%
1,098
1,694
1,525
72%
1,694
1,525
72%
DeLaura
Middle
7-8
90%
703
1,046
941
75%
1,046
941
75%
Hoover
Middle
7-8
90%
509
732
659
77%
732
659
77%
Jackson
Middle
7-8
90%
584
727
654
89%
727
654
89%
Jefferson
Middle
7-8
90%
606
949
854
71%
949
854
71%
Johnson
Middle
7-8
90%
791
1,111
1,000
79%
1,111
1,000
79%
Kennedy
Middle
7-8
90%
632
749
674
94%
7
154
139
903
813
78%
Madison
Middle
7-8
90%
444
825
743
60%
825
743
60%
McNair
Middle
7-8
90%
456
679
611
75%
679
611
75%
Southwest
Middle
7-8
90%
880
1,308
1,177
75%
1,308
1,177
75%
Stone
Middle
7-8
90%
839
1,126
1,013
83%
1,126
1,013
83%
Cocoa
Jr / Sr High
PK, 7-12
90%
1,572
1,730
1,557
101%
10
250
225
1,980
1,782
88%
Cocoa Beach
Jr / Sr High
7-12
90%
1,064
1,253
1,128
94%
15
375
338
1,628
1,466
73%
Edgewood
Jr / Sr High
7-12
90%
948
1,100
990
96%
6
91
82
1,191
1,072
88%
Space Coast
Jr / Sr High
7-12
90%
1,519
1,975
1,778
85%
2
38
34
2,013
1,812
84%
West Shore
Jr / Sr High
7-12
90%
955
1,232
1,109
86%
7
172
155
1,404
1,264
76%
Facilities Services / DGL Board Approved March 28, 2017 Page 2 of 3
