
Page 31 - Final Approved 2017-2018 Student Accommodation Plan 2017-03-29
P. 31
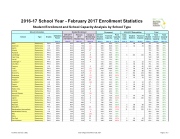
2016-17 School Year - February 2017 Enrollment Statistics Student Enrollment and School Capacity Analysis by School Type
School Information
Student Enrollment
Permanent
2016-2017 Relocatables
Total
School
Type
Grades
Utilization Factor
(Note 1)
2016-2017 Membership (10/17/2016) (Note 2)
February 2017 Membership (Note 11)
Change in Membership Oct. to Feb. (Note 12)
2016-17 Student Stations (Note 3)
Factored Capacity
(Note 4)
Perm Capacity In Use (Note 5)
Class- room Units (Note 6)
Student Stations
(Note 7)
Factored Capacity
(Note 8)
Total Student Stations (Note 9)
Total Factored Capacity (Note 9)
Total Capacity In Use (Note 10)
Allen
Elementary
PK-6
100%
632
657
25
663
663
99%
5
88
88
751
751
88%
Andersen
Elementary
K-6
100%
701
700
(1)
840
840
83%
2
44
44
884
884
79%
Apollo
Elementary
K-6
100%
815
810
(5)
902
902
90%
902
902
90%
Atlantis
Elementary
PK-6
100%
648
665
17
703
703
95%
703
703
95%
Audubon
Elementary
PK-6
100%
599
604
5
761
761
79%
761
761
79%
Cambridge
Elementary
PK-6
100%
640
648
8
649
649
100%
6
116
116
765
765
85%
Cape View
Elementary
PK-6
100%
426
418
(8)
548
548
76%
548
548
76%
Carroll
Elementary
K-6
100%
660
664
4
751
751
88%
751
751
88%
Challenger 7
Elementary
PK-6
100%
525
529
4
551
551
96%
1
22
22
573
573
92%
Columbia
Elementary
PK-6
100%
544
544
685
685
79%
3
66
66
751
751
72%
Coquina
Elementary
K-6
100%
523
532
9
627
627
85%
3
66
66
693
693
77%
Creel
Elementary
PK-6
100%
940
937
(3)
1,088
1,088
86%
3
66
66
1,154
1,154
81%
Croton
Elementary
PK-6
100%
615
612
(3)
707
707
87%
4
88
88
795
795
77%
Discovery
Elementary
PK-6
100%
625
629
4
826
826
76%
7
154
154
980
980
64%
Endeavour
Elementary
PK-6
100%
890
887
(3)
852
852
104%
7
138
138
990
990
90%
Enterprise
Elementary
K-6
100%
543
538
(5)
707
707
76%
1
22
22
729
729
74%
Fairglen
Elementary
PK-6
100%
703
728
25
753
753
97%
753
753
97%
Freedom 7
Elementary
K-6
100%
409
399
(10)
453
453
88%
1
22
22
475
475
84%
Gemini
Elementary
K-6
100%
451
458
7
667
667
69%
2
44
44
711
711
64%
Golfview
Elementary
PK-6
100%
619
636
17
689
689
92%
4
88
88
777
777
82%
Harbor City
Elementary
PK-6
100%
401
420
19
453
453
93%
8
176
176
629
629
67%
Holland
Elementary
PK-6
100%
466
469
3
605
605
78%
605
605
78%
Imperial Estates
Elementary
K-6
100%
718
710
(8)
729
729
97%
729
729
97%
Indialantic
Elementary
K-6
100%
751
754
3
754
754
100%
2
44
44
798
798
95%
Jupiter
Elementary
PK-6
100%
793
801
8
780
780
103%
7
150
150
930
930
86%
Lockmar
Elementary
PK-6
100%
728
733
5
892
892
82%
892
892
82%
Longleaf
Elementary
PK-6
100%
683
685
2
790
790
87%
790
790
87%
Manatee
Elementary
K-6
100%
864
864
866
866
100%
5
88
88
954
954
91%
McAuliffe
Elementary
PK-6
100%
786
799
13
754
754
106%
8
164
164
918
918
87%
Meadowlane Intermediate
Elementary
3-6
100%
1,010
1,009
(1)
894
894
113%
11
220
220
1,114
1,114
91%
Meadowlane Primary
Elementary
K-6
100%
748
751
3
824
824
91%
824
824
91%
Mila
Elementary
PK-6
100%
534
508
(26)
707
707
72%
707
707
72%
Mims
Elementary
PK-6
100%
485
503
18
725
725
69%
725
725
69%
Oak Park
Elementary
PK-6
100%
922
943
21
906
906
104%
2
44
44
950
950
99%
Ocean Breeze
Elementary
PK-6
100%
519
530
11
498
498
106%
8
156
156
654
654
81%
Facilities Services / DGL Board Approved March 28, 2017 Page 1 of 3
