
Page 33 - Final Approved 2017-2018 Student Accommodation Plan 2017-03-29
P. 33
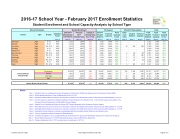
2016-17 School Year - February 2017 Enrollment Statistics Student Enrollment and School Capacity Analysis by School Type
School Information
Student Enrollment
Permanent
2016-2017 Relocatables
Total
School
Type
Grades
Utilization Factor
(Note 1)
2016-2017 Membership (10/17/2016) (Note 2)
February 2017 Membership (Note 11)
Change in Membership Oct. to Feb. (Note 12)
2016-17 Student Stations (Note 3)
Factored Capacity
(Note 4)
Perm Capacity In Use (Note 5)
Class- room Units (Note 6)
Student Stations
(Note 7)
Factored Capacity
(Note 8)
Total Student Stations (Note 9)
Total Factored Capacity (Note 9)
Total Capacity In Use (Note 10)
Astronaut
High
9-12
95%
1,132
1,099
(33)
1,522
1,446
76%
1,522
1,446
76%
Bayside
High
9-12
95%
1,712
1,689
(23)
2,353
2,235
76%
2,353
2,235
76%
Eau Gallie
High
PK, 9-12
95%
1,672
1,640
(32)
2,050
1,948
84%
10
250
238
2,300
2,186
75%
Heritage
High
9-12
95%
1,855
1,817
(38)
2,436
2,314
79%
2,436
2,314
79%
Melbourne
High
9-12
95%
2,304
2,253
(51)
2,439
2,317
97%
2,439
2,317
97%
Merritt Island
High
PK, 9-12
95%
1,574
1,559
(15)
1,965
1,867
84%
2
50
48
2,015
1,915
81%
Palm Bay
High
PK, 9-12
95%
1,637
1,620
(17)
2,576
2,447
66%
7
175
166
2,751
2,613
62%
Rockledge
High
9-12
95%
1,460
1,443
(17)
1,703
1,618
89%
3
75
71
1,778
1,689
85%
Satellite
High
PK, 9-12
95%
1,356
1,333
(23)
1,570
1,492
89%
1
25
24
1,595
1,516
88%
Titusville
High
9-12
95%
1,394
1,356
(38)
1,970
1,872
72%
1,970
1,872
72%
Viera
High
PK, 9-12
95%
2,117
2,102
(15)
2,246
2,134
99%
5
125
119
2,371
2,253
93%
School District Group Totals
Elementary
35,293
35,587
294
39,567
39,567
90%
153
3,190
3,190
42,757
42,757
83%
Middle
7,542
7,525
(17)
10,946
9,851
76%
7
154
139
11,100
9,990
75%
Jr/Sr High
6,058
5,992
(66)
7,290
6,562
91%
40
926
834
8,216
7,396
81%
High
18,213
17,911
(302)
22,830
21,690
83%
28
700
666
23,530
22,356
80%
School District Grand Totals
67,106
67,015
(91)
80,633
77,670
86%
228
4,970
4,829
85,603
82,499
81%
Notes:
Note 1: Note 2: Note 3: Note 4:
Note 5: Note 6: Note 7: Note 8: Note 9:
Note 10: Note 11: Note 12:
Utilization Factors are established by the Florida Department of Education's (FDOE) State Requirements for Educational Facilities (SREF).
Student Membership based on Final Fall Membership Count (10/17/16)
Permanent Student Stations are based on the information contained in the FDOE Florida Inventory of School Houses (FISH) database on 12/13/16 Factored Capacity is calculated by multiplying Satisfactory Student Stations by the Utilization Factor. Total Factored Capacity is the addition of the Permanent Factored Capacity plus the Relocatable Factored Capacity.
Capacity in Use is calculated by dividing the January 2017 Student Membership by the Permanent Factored Capacity.
Relocatable Classroom Units are based on the information contained in the FDOE Florida Inventory of School Houses (FISH) database on 12/13/16 Relocatable Student Stations are based on the information contained in the FDOE Florida Inventory of School Houses (FISH) database on 12/13/16 Relocatable Factored Capacity is calculated by multiplying Satisfactory Relocatable Student Stations by the Utilization Factor.
Totals are calculated by adding Permanent and Relocatable data.
Total Factored Capacity in use is calculated dividing the enrollment from the January 2017 Membership Analysis by the Total Factored Capacity. Student Membership based on 1/13/2017 Membership Analysis provided by BPS Finance Department.
Change in Membership is the 1/13/17 enrollment minus the enrollment on 10/17/16.
Facilities Services / DGL Board Approved March 28, 2017 Page 3 of 3
