
Page 12 - BPS PFAR Report Fiscal Year 2021
P. 12
Federal Direct $ 786547 014% $ 595095 010% $ 769392 013%
Federal N/A $ 000% $ 000% $
000%
R
l
,.,.,. 2,278,768 0.41% $ 3,576,681 0.63% $ 4,068,023 0.71% TOTAL $ 554,481,106 100.00% $ 567,312,097 100.00% $ 574,932,166 100.00%
Grants $
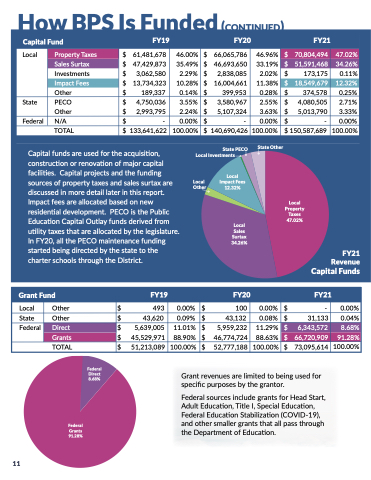
How BPS Is Funded (continued)
Debt Services
FY19 FY20 FY21
Grant Fund
FY21 Revenue - Food Services
FY19
FY20 FY21
Local
Local
Investments
Other
$
$ 164,729
493
27.43%
0.00%
$ 133,368
$ 100
FY21 Re
28.05%
0.00%
venue - Debt S
$ 46
$-
ervices
0.01%F 0.00%
State
Other
Other
$$ 43,620 -
0.00%
0.09%
$-
$ 43,132
0.00%
0.08%
$-
$ 31,133
0.00%
0.04%
State
Federal
Federal
Other
Direct
Fo
$ 435,774
Local
$ 5,639,005
od Sales
8.3$2% - $ 45,529,971
72.57%
11.01%
0.00%
88.90%
$ 342,045
$ 5,959,232
$-
$ 46,774,724
71.95%
11.29%
0.00%
88.63%
$ 311,712
$ 6,343,572
99.99%
8.68%
N/A
Grants
$-
$ 66,720,909
0.00%
91.28%
TOTAL
TOTAL
FY21 Revenue - Grant Funds
$
$ 600,503
51,213,089
100.00%
100.00%
$ 475,413
$ 52,777,188
100.00%
100.00%
$ 311,758
$ 73,095,614
100.00%
100.00%
Y21
Food Services Federal
Local
State Federal
FY19 FY20 FY21
Grant revenues are limited to being used for
Debt Services
FY20
FY21
Local
11
State
Investments Other Other
$ 133,368 28.05% $
Direct Food Sales 8.68%
$ 9,510,027 27.17% $ 7,252,554 21.33% $ 3,383,801 8.32%Capita
Federal Other Food Services
$ 13,067
$ 340,223
specific purposes by the grantor.
Funds
Food Services
Food Services
TOTAL
Adult Education, Title I, Special Education,
Federal Grants 91.28%
99.99%
90.16%
0.04% $ 41,112 0.12% $ 285,232 0F.9e7d%era$l source3s47in,1c8lu8de g1ra.0n2t%s fo$r Head33S2ta,8r0t,7
0.70% .82%
$ 25,132,432 71.82% $ 26,355,335 77.52% $ 36,666,862 90.16%
FY19
the Department of Education.
46 0.01% - 0.00% $ 342,045 71.95% $ 311,712 99.99%
State
Federal Education StabilizOathtieron (COVID-19),
$ 34,995,749 100.00% $ 33,996,189 100.00% $ 40,668,702 100.00%
and other smaller grants that all pass through
$ 164,729 27.43%
$ - 0.00% $ - 0.00% $ $ 435,774 72.57%
FY19 FY20 FY21 Local $ 61,481,678 46.00% $ 66,065,786 46.96%
Capital Fund
General
FY19 FY20
Property Taxes
Sales Surtax
Investments
PrIomppeartcyt TFaexeess
InvOetshtemrents
$ 47,429,873 35.49% $ 46,693,650 33.19%
$ 3,062,580 2.29% $ 2,838,085 2.02% Local $$19163,7,78394,4,36283 3150.4298% $ 21060,00348,,676312 1315..3681% $$ 2,815889,,831387 0.5124% $ 13,89592,9,75232 0.2.383%
$ 70,804,494
$ 51,591,468
$ 173,175
$ 20198,,751449,860739
$ 132740,50758
47.02%
34.26%
0.11%
1326..3428%
State
State
Federal
O tPhEeCr O FEOFtPher
CaNte/Agoricals
OtThOeTr A(ILncludes
$$ 94,2,79570,,109356 $$ 2452,092963,978965
$$ 83,910,092-
$ 133,5,63431,2,6322
13.6585% 424.2149%
105.0103%
1020.4040%
$ 39,5,58705,9,36571 $ 258,1,40178,3,72846
$ 86,062,87-6
$ 1405,61901,,482564
21.5.659% 435.6.535%
105.0.107%
100.0.902%
$ 114,107810,458065 $ 2625,403143,27790
$ 82,404,103-
$ 1504,528570,608391
0.2.052%
21.7.914% 435.3.635%
104.0.303%
100.00%
0.74%
Fund
Federal Direct GrantFuGnrdants
Local $ 786,547 0.14% $
FY21
595,095 0.10% $ 769,392 0.13%
Investments Federal State PECO
$ 2,278,F7Y6819 0.41% $ 3,576F,6Y8210 0.63% $ 4,068F,0Y2231 0.71%
State
Capital funds are used for the acqGuraisntistion, Local Investments
TOTAL Other $ 554,481,106 100.00% $ 567,312,097 100.00% $ 574,932,166 100.00%
Loccoanl structiOothneor r renovation of$major capi4ta9l3 0.00% $ Stfatceilities.OCthaeprital projects and$ the fun4d3i,n6g20 0.09% $
100 43,132
0.00%
$ - 0.00%
State
Local
0.08%
11.29%
$
31,133 0.04%
Fesdoeurracles oDfirpercotperty taxes and$sales5,s6u3r9t,a0x05are 11.01% $
Capital Fund Categoricals 14.33%
Local
Impact Fees
$
$ 66,720,909 91.28%
FY19
FY20
FY21
5,959,232
6,343,572 8.68%
State Other
discussedGirnanmtsore detail later$in th4i5s,5re2p9o,9r7t.1 88.90%
$ 46,774,724 88.63%
$ 70,804,494 47.02%
Local PropertyTaxes $ 61,481,678 46.00% Local
$ 66,065,786 46.96%
$Lo7ca3l,095,614 100.00% $ 51,591,468 34.26%
Impact feTeOsTaArLe allocated bas$ed o5n1n,2e1w3,089 100.00% Property
$ 52,777,188 100.00%
Food Services
FY19
FY20
47.02% FY21
$ 18,549,679 12.32%
SalesSurtax $ 47,429,873 35.49% Taxes
$ 46,693,650 33.19% $ 2,838,085 2.02%
Property
residential development. PECO is the Public
Taxes
Investments $
ImpactFees $ 13,734,323 10.28% utility taxes that are allocated by the legislature.
$ 173,175 0.11%
Education Capital Outlay funds derived from
$ 16,004,661 11.38%
Local Food Sales $ Other $
9,510,027 27.17%
Local
In FY20, all the PECO maintenance funding
Other State $ 13,067 0.04%
$
4314,.1261%2 0.12% 3,580,967 2.55%
$
285,232
0.70%
State PECO $
4,750,036 3.55%
$
$
4,080,505
2.71%
started being directed by the state to the
State Food Services FEFP $ 340,223 0.97%
$
347,188 1.02% 5,107,324 3.63%
$
332,807
.82%
Other 45.65%
charter schools through the District.
2.24%
$
Federal FoodServices Federal N/A
$ 25,132,432 71.82%
$ 26,355,335 77.52% $ - 0.00%
$
36,666,862 90.16%
TOTAL
$ 40,66C8,a7p02ita1l0F0u.0n0d%s $ 150,587,689 100.00%
TOTAL
$ 133,641,622 100.00%
3,062,580 2.29%
36.48%
189,337 0.14%
$
Sales
$
374,578
0.25%
$ 2,993,795
$ - Direc0t.00% $ 34,995,749 100.00%
3.33%
Local
Other
Federal
$
Revenue
Other
12.32%
$
7,252,554 21.33% 399S,9ur5ta3x 0.28%
$
3,383,801
8.32%
$ 33,996,189 100.00% $ 140,690,426 100.00%
- 0.00%
$
5,013,790
FY21
