
Page 24 - Sites_December 16
P. 24
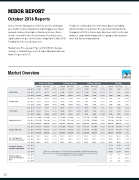
MIBOR REPORT
October 2016 Reports
As we enter the  nal quarter of 2016, we are in a comfortable pace thanks to low unemployment and mortgage rates. Buyer demand continues to be high as it has been for more than a decade, even with the decline in inventory. Closed Sales rose signi cantly to 6.4 percent in October compared to October 2015. Pending Sales decreased 3.4 percent.
Median Sales Price was up 7.7 percent to $153,000. Average sales price climbed 5.7 percent in October. Absorption Rate was down 21.3 percent to 3.7.
Despite the continued decline in inventory, buyers are  nding options in today’s local market. The expectation moving into the  nal quarter of 2016 is that as older Americans start to retire and downsize, single-family listings will rise, giving us that inventory boost that has been long awaited.
24
Aug 2016 PendingSales Sep 2016 Oct 2016
Rolling 12 Months
Current Prior Year + / –
32,464 29,378 32,467 29,724 32,383 29,868
+ 10.5% + 9.2% + 8.4%
Rolling 6 Months
Current Prior Year + / –
18,724 17,242 18,297 17,255 17,448 16,657
+ 8.6% + 6.0% + 4.7%
Rolling 3 Months
Current Prior Year + / –
12,888 12,692 11,902 11,456 10,886 10,740
+ 1.5% + 3.9% + 1.4%
Monthly
Current Prior Year + / –
Aug 2016 NewListings Sep 2016 Oct 2016
43,307 42,871 43,512 42,618 43,359 42,694
+ 1.0% + 2.1% + 1.6%
26,238 25,953 25,505 25,370 24,195 24,035
+ 1.1% + 0.5% + 0.7%
4,032 3,938 3,617 3,412 3,237 3,390
+ 2.4% + 6.0% - 4.5%
9,101 8,406 8,607 8,149 8,142 7,827
+ 8.3% + 5.6% + 4.0%
3,061 2,665 2,695 2,692 2,386 2,470
+ 14.9% + 0.1% - 3.4%
Aug 2016 ClosedSales Sep 2016 Oct 2016
34,249 31,866 34,658 31,876 34,830 31,844
+ 7.5% + 8.7% + 9.4%
20,265 18,511 20,801 18,863 20,573 18,801
+ 9.5% + 10.3% + 9.4%
10,783 10,081 9,432
10,180 9,270 8,463
+ 5.9% + 8.7% + 11.4%
3,392 3,004 3,196 2,787 2,844 2,672
+ 12.9% + 14.7% + 6.4%
Aug 2016 MedianSalesPrice Sep 2016 Oct 2016
Aug 2016 AverageSalesPrice Sep 2016 Oct 2016
Pct. of Original List Price Received at Sale
Aug 2016 Sep 2016 Oct 2016
$150,000 $151,500 $152,500
$145,000 $145,500 $146,000
+ 3.4% + 4.1% + 4.5%
$186,536 $187,987 $188,747
$181,879 $182,659 $182,640
+ 2.6% + 2.9% + 3.3%
$156,000 $157,900 $158,000
$150,900 $151,900 $150,000
+ 3.4% + 3.9% + 5.3%
$192,000 $194,148 $194,556
$188,229 $188,782 $187,946
+ 2.0% + 2.8% + 3.5%
$159,500 $157,500 $155,000
$155,000 $150,000 $147,100
+ 2.9% + 5.0% + 5.4%
$196,947 $194,492 $192,459
$193,007 $189,006 $182,511
+ 2.0% + 2.9% + 5.5%
95.7% 94.7% 95.4% 94.3% 95.0% 93.9%
+ 1.1% + 1.2% + 1.2%
$154,900 $159,900 $153,000
$150,000 $147,500 $142,000
+ 3.3% + 8.4% + 7.7%
$192,140 $197,696 $186,902
$188,604 $181,298 $176,881
+ 1.9% + 9.0% + 5.7%
94.5% 93.6%
94.6% 93.6%
94.6% 93.7%
+ 1.0% + 1.1% + 1.0%
95.3% 94.3% 95.5% 94.4% 95.4% 94.3%
+ 1.1% + 1.2% + 1.2%
95.4% 94.5% 95.0% 93.7% 94.4% 93.4%
+ 1.0% + 1.4% + 1.1%
Aug 2016 AvailableatMonthEnd Sep 2016 Oct 2016
Total Active Listings
There are no rolling figures for Total Active Listings Available at Month End or Absorption Rate because these metrics are simply snapshots frozen in time at the end of each month. It does not add up over a period of months.
11,334 13,074 11,013 12,774 10,690 12,571
- 13.3% - 13.8% - 15.0%
Months Supply of Inventory/Absorption Sep 2016
Rate
Oct 2016
Aug 2016
4.0 4.9 3.8 4.8 3.7 4.7
- 18.4% - 20.8% - 21.3%
Market Overview
Key market metrics for the current month as well as for rolling segments in which the given value represents 3, 6 or 12 months of activity.
Data obtained from the Broker Listing Cooperative® (BLC®). Report format © 2016 ShowingTime. | 2
