
Page 25 - Sites_December 16
P. 25
Percent of Original List Price Received
Percentage found when dividing a property’s sales price by its original list price, then taking the average for all properties sold in a given month, not accounting for seller concessions.
Inventory of Homes for Sale
The number of properties available for sale in active status at the end of a given month. There are no rolling figures for Inventory of Homes for Sale because this metric is simply a snapshot frozen in time at the end of each month. It does not add up over a period of months.
12 Month
93.2% 93.7%
94.6%
One-Year Change: + 1.0%
Two-Year Change: + 1.5%
6 Month
93.9%
3 Month
93.4%
93.9%
95.0%
October
93.1%
93.4%
94.4%
One-Year Change: + 1.1%
Two-Year Change: + 1.4%
October
14,102
12 Month
$175,202 $182,640
2014 2015
6 Month
$180,325
2014
3 Month
October
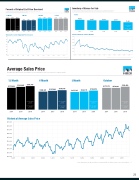
Historical Average Sales Price
$210,000 $200,000 $190,000 $180,000 $170,000 $160,000 $150,000 $140,000 $130,000
$120,000
1-2005 1-2006
1-2007
1-2008
1-2009
1-2010 1-2011
1-2012
1-2013 1-2014
1-2015
1-2016
94.3%
95.4%
One-Year Change: + 1.2%
Two-Year Change: + 1.6%
13,405
13,313
12,571
2014 2015 2016 2014 2015 2016 2014 2015 2016 2014 2015 2016 Historical Percent of Original List Price Received
98% 96% 94% 92% 90% 88% 86% 84%
1-2005 1-2006 1-2007 1-2008 1-2009 1-2010 1-2011 1-2012 1-2013 1-2014 1-2015 1-2016
Data obtained from the Broker Listing Cooperative® (BLC®). Report format © 2016 ShowingTime. | 8
Average Sales Price
Average sales price for all closed sales, not accounting for seller concessions, in a given month.
2012 2013 2014 2015 2016
Historical Inventory of Homes Available
60,000
50,000
40,000
30,000
20,000
10,000
0
1-2005 1-2006 1-2007 1-2008 1-2009 1-2010 1-2011 1-2012 1-2013 1-2014 1-2015 1-2016
$188,747
One-Year Change: + 3.3%
Two-Year Change: + 7.7%
2016
$177,175
$176,881
2015
$186,902
One-Year Change: + 5.7%
Two-Year Change: + 5.5%
2016
One-Year Change: + 1.2%
Two-Year Change: + 1.7%
10,690
One-Year Change: - 15.0% Two-Year Change: - 19.7%
$187,946
2015
$194,556 $177,727
One-Year Change: + 3.5%
Two-Year Change: + 7.9%
2016 2014
$182,511
2015
$192,459
One-Year Change: + 5.5%
Two-Year Change: + 8.3%
2016 2014
Data obtained from the Broker Listing Cooperative® (BLC®). Report format © 2016 ShowingTime. | 7
Data obtained from the Broker Listing Cooperative® (BLC®). Report format © 2016 ShowingTime. | 9
25
