
Page 41 - October_sites 17
P. 41
Percent of Original List Price Received
Percentage found when dividing a property’s sales price by its original list price, then taking the average for all properties sold in a given month, not accounting for seller concessions.
Months Supply of Inventory / Absorption Rate
The inventory of homes for sale at the end of a given month, divided by the average monthly pending sales from the last 12 months. There are no rolling figures for this metric because it is simply a snapshot frozen in time at the end of each month. It does not add up over a period of months.
12 Month
6 Month
94.3%
2015
3 Month
94.7%
2015
August
August
93.6%
2015
94.5%
Two-Year Change: + 1.8%
2016
95.3%
One-Year Change: + 0.8%
2017
95.3%
Two-Year Change: + 1.8%
2016
96.0%
One-Year Change: + 0.7%
2017
95.7%
Two-Year Change: + 1.7%
2016
96.3%
One-Year Change: + 0.6%
2017
94.5%
2015
95.4%
Two-Year Change: + 1.5%
2016
95.9%
One-Year Change: + 0.5%
2017
5.6 5.8
2013 2014
4.9
Historical Percent of Original List Price Received
98% 96% 94% 92% 90% 88% 86% 84%
Historical Months Supply of Inventory / Absorption Rate
1-2005 1-2006 1-2007 1-2008 1-2009 1-2010 1-2011 1-2012 1-2013 1-2014 1-2015 1-2016 1-2017
Data obtained from the Broker Listing Cooperative® (BLC®). Report format © 2017 ShowingTime. | 8
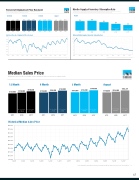
Median Sales Price
Median price point for all closed sales, not accounting for seller concessions, in a given month.
13 12 11 10 9 8 7 6 5 4 3 2 1 0
1-2007 1-2008
1-2009
1-2010
1-2011
1-2012
1-2013 1-2014
1-2015
1-2016
12 Month
6 Month
$150,900
2015
3 Month
$155,000
Two-Year Change: + 9.4%
2015 2016
August
$150,000
2015
$145,000
2015
$150,000
Two-Year Change: + 10.3%
2016
$160,000
One-Year Change: + 6.7%
2017
$156,000
Two-Year Change: + 9.3%
2016
$165,000
One-Year Change: + 5.8%
2017
$159,500
$169,500
One-Year Change: + 6.3%
2017
$154,900
Two-Year Change: + 9.5%
2016
$164,275
One-Year Change: + 6.1%
2017
Historical Median Sales Price
$180,000 $170,000 $160,000 $150,000 $140,000 $130,000 $120,000 $110,000 $100,000
$90,000
1-2005 1-2006 1-2007 1-2008 1-2009 1-2010 1-2011 1-2012 1-2013 1-2014 1-2015 1-2016 1-2017
Data obtained from the Broker Listing Cooperative® (BLC®). Report format © 2017 ShowingTime. | 6
2015 2016
2017
1-2017
4.0
Two-Year Change: - 34.7%
3.2
One-Year Change: - 20.0%
Data obtained from the Broker Listing Cooperative® (BLC®). Report format © 2017 ShowingTime. | 10
41
