
Page 40 - October_sites 17
P. 40
MIBOR REPORT
August 2017
August brings more than just the start of the school year. It also marks the slow onset of a natural market cool-down before any actual temperature change in the weeks to come. Competition is expected to remain strong for available listings.
Savvy sellers and buyers should continue to push forward as was true during the earlier summer months.
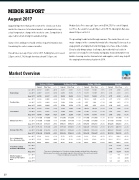
Closed Sales were up 3.7 percent to 3,519. Pending Sales increased 2.5 percent to 3,136, though Inventory shrank 13.3 percent.
Median Sales Price was up 6.1 percent to $164,275. Percent of Original List Price Received increased 0.5 percent to 95.9%. Absorption Rate was down 20.0 percent to 3.2.
The prevailing trends lasted through summer. The market has not seen major changes in the economy that would affect housing. Factors such as wage growth, unemployment and mortgage rates have all been stable. Every locality brings unique challenges, but residential real estate in general is in steady. Recent manufacturing data shows demand for new builds—housing construction materials and supplies, which may help lift the ongoing low inventory situation in 2018.
40
Market Overview
Key market metrics for the current month as well as for rolling segments in which the given value represents 3, 6 or 12 months of activity.
Jun 2017 Pending Sales Jul 2017 Aug 2017
Rolling 12 Months
Current Prior Year + / –
33,368 32,009 33,531 32,068 33,606 32,464
+ 4.2% + 4.6% + 3.5%
Rolling 6 Months
Current Prior Year + / –
18,338 17,294 19,203 18,108 19,789 18,724
+ 6.0% + 6.0% + 5.7%
Rolling 3 Months
Current Prior Year + / –
13,348 13,603 13,293 13,309 13,031 12,888
- 1.9% - 0.1% + 1.1%
Monthly
Current Prior Year + / –
Jun 2017 New Listings Jul 2017 Aug 2017
43,127 43,066 43,017 43,213 43,156 43,307
+ 0.1% - 0.5% - 0.3%
23,361 23,651 24,923 25,352 25,974 26,238
- 1.2% - 1.7% - 1.0%
4,717 4,603 4,143 4,253 4,171 4,032
+ 2.5% - 2.6% + 3.4%
10,356 9,690 9,987 9,306 9,661 9,101
+ 6.9% + 7.3% + 6.2%
3,511 3,189 3,014 2,851 3,136 3,061
+ 10.1% + 5.7% + 2.5%
Jun 2017 Closed Sales Jul 2017 Aug 2017
36,293 33,847 36,261 33,861 36,388 34,249
+ 7.2% + 7.1% + 6.2%
17,954 17,094 19,609 18,857 21,144 20,265
+ 5.0% + 4.0% + 4.3%
10,958 10,720 11,302 11,141 11,148 10,783
+ 2.2% + 1.4% + 3.4%
4,168 3,898 3,461 3,493 3,519 3,392
+ 6.9% - 0.9% + 3.7%
Jun 2017 Median Sales Price Jul 2017 Aug 2017
Jun 2017 Average Sales Price Jul 2017 Aug 2017
Pct. of Original List Price Received at Sale
Jun 2017 Jul 2017 Aug 2017
$159,000 $160,000 $160,000
$150,000 $150,000 $150,000
+ 6.0% + 6.7% + 6.7%
$195,332 $196,808 $198,049
$186,320 $186,155 $186,536
+ 4.8% + 5.7% + 6.2%
$162,000 $165,000 $165,000
$152,000 $154,900 $156,000
+ 6.6% + 6.5% + 5.8%
$197,740 $201,161 $203,059
$187,066 $189,685 $192,000
+ 5.7% + 6.1% + 5.8%
$168,000 $170,000 $169,500
$158,000 $160,000 $159,500
+ 6.3% + 6.3% + 6.3%
$204,487 $208,553 $209,306
$193,824 $196,329 $196,947
+ 5.5% + 6.2% + 6.3%
96.3% 95.6% 96.5% 95.8% 96.3% 95.7%
+ 0.7% + 0.7% + 0.6%
$173,355 $169,500 $164,275
$163,000 $158,900 $154,900
+ 6.4% + 6.7% + 6.1%
$212,914 $209,227 $205,108
$203,913 $193,845 $192,140
+ 4.4% + 7.9% + 6.7%
95.2% 94.2%
95.2% 94.4%
95.3% 94.5%
+ 1.1% + 0.8% + 0.8%
95.5% 94.7% 95.8% 95.1% 96.0% 95.3%
+ 0.8% + 0.7% + 0.7%
96.7% 96.0% 96.3% 95.7% 95.9% 95.4%
+ 0.7% + 0.6% + 0.5%
Jun 2017 Available at Month End Jul 2017 Aug 2017
Total Active Listings
There are no rolling figures for Total Active Listings Available at Month End or Absorption Rate because these metrics are simply snapshots frozen in time at the end of each month. It does not add up over a period of months.
9,314 11,150 9,625 11,377 9,826 11,334
- 16.5% - 15.4% - 13.3%
Months Supply of
Inventory / Absorption Jul 2017
Rate
Aug 2017
Jun 2017
3.1 4.0
3.2 4.0
3.2 4.0
- 22.5% - 20.0% - 20.0%
Data obtained from the Broker Listing Cooperative® (BLC®). Report format © 2017 ShowingTime. | 2
