


Page 22 - Sites_May 16
P. 22
MIBOR REPORT
Continued Growth and Activity in 2016
First quarter housing numbers rose in central Indiana while the industry continues to keep a watchful eye on inventory numbers. Listings, Units Sold and Prices all climbed at a healthy pace in the  rst part of 2016.
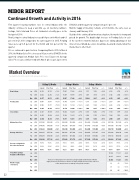
New Listings in central Indiana increased 8.9 percent in March and 4.3 percent in Q1 2016 compared to the same quarter in 2015. Pending Sales were up 16.5 percent for the month and 14.6 percent for the quarter.
Prices continued to gain traction. Comparing March 2015 to March 2016, the Median Sales Price increased 6.3 percent to $148,750. In the quarterly comparison, Median Sales Price rose 5.2 percent. Average Sales Prices saw a similar trend with March prices up 3.4 percent to
$182,023 and the quarterly comparison up 3.1 percent.
Months Supply of Inventory remains at 3.8 months, the same level as January and February 2016.
Outside of the continued low inventory situation, the market is strong and poised for growth. The double digit increase in Pending Sales in each of the last three months indicates buyers are taking advantage of low interest rates. Would-be sellers should take heed and consider what this market has to offer them.
Market Overview
Key market metrics for the current month and year-to-date figures.
New Listings
Pending Sales Jan 2016 Feb 2016 Mar 2016
Jan 2016 Feb 2016 Mar 2016
Rolling 12 Months
Current Prior Year + / –
42,722 42,155 43,022 42,492 43,377 42,513
+ 1.3% + 1.2% + 2.0%
Rolling 6 Months
Current Prior Year + / –
17,861 17,832 17,069 16,918 18,007 17,248
+ 0.2% + 0.9% + 4.4%
13,960 12,538 13,740 12,136 14,170 12,469
+ 11.3% + 13.2% + 13.6%
Rolling 3 Months
Current Prior Year + / –
Monthly
Current Prior Year + / –
7,121 7,093 7,673 7,616 10,048 9,637
+ 0.4% + 0.7% + 4.3%
2,552 2,796 3,146 2,846 4,350 3,995
- 8.7% + 10.5% + 8.9%
2,037 1,814 2,445 2,144 3,122 2,679
+ 12.3% + 14.0% + 16.5%
Closed Sales
Median Sales Price Jan 2016 Feb 2016 Mar 2016
Jan 2016 Feb 2016 Mar 2016
30,681 27,651 30,982 27,911 31,425 28,144
+ 11.0% + 11.0% + 11.7%
32,321 29,836 32,495 30,038 32,720 30,334
+ 8.3% + 8.2% + 7.9%
$147,900 $148,000 $148,263
$139,900 $140,000 $140,000
+ 5.7% + 5.7% + 5.9%
15,004 14,436 13,984 13,355 13,857 13,013
+ 3.9% + 4.7% + 6.5%
$145,000 $142,000 $142,500
$139,000 $136,500 $136,000
+ 4.3% + 4.0% + 4.8%
6,133 5,320 6,425 5,588 7,604 6,637
+ 15.3% + 15.0% + 14.6%
6,541 6,064 6,368 5,789 6,374 5,844
+ 7.9% + 10.0% + 9.1%
1,730 1,599 1,984 1,810 2,660 2,435
+ 8.2% + 9.6% + 9.2%
Average Sales Price
Percent of Original List Price Received at Sale
Jan 2016 Feb 2016 Mar 2016
Jan 2016 Feb 2016 Mar 2016
$183,947 $184,076 $184,508
$175,782 $176,380 $177,136
+ 4.6% + 4.4% + 4.2%
93.8% 93.3%
93.8% 93.3%
93.9% 93.3%
+ 0.5% + 0.5% + 0.6%
$181,691 $178,550 $178,668
$175,926 $173,004 $173,710
+ 3.3% + 3.2% + 2.9%
93.5% 92.9% 93.2% 92.6% 93.2% 92.5%
+ 0.6% + 0.6% + 0.7%
$142,000 $139,900 $142,000
$134,600 $132,000 $135,000
+ 5.5% + 6.0% + 5.2%
$180,625 $176,205 $175,620
$173,425 $170,062 $170,328
+ 4.2% + 3.6% + 3.1%
92.9% 92.3% 92.9% 92.1% 93.3% 92.3%
+ 0.7% + 0.9% + 1.1%
$137,500 $135,000 $148,750
$127,250 $131,500 $140,000
+ 8.1% + 2.7% + 6.3%
$172,016 $170,125 $182,023
$166,116 $166,384 $175,991
+ 3.6% + 2.2% + 3.4%
Total Active Listings Available at Month End
Months Supply of Inventory
Jan 2016 Feb 2016 Mar 2016
Jan 2016 Feb 2016 Mar 2016
There are no rolling figures for Total Active Listings Available at Month End or Months Supply of Inventory because these metrics are simply snapshots frozen in time at the end of each month. It does not add up over a period of months.
92.9% 91.9% 92.9% 91.7% 93.9% 92.9%
+ 1.1% + 1.2% + 1.1%
10,186 11,121 10,255 10,914 10,490 11,348
- 8.4% - 6.0% - 7.6%
3.8 4.5 3.8 4.4 3.8 4.5
- 15.4% - 13.1% - 14.3%
22
DataobtainedfromtheBrokerListingCooperative®(BLC®).Totalsroundedtowholenumberortenthofapercent;roundingerrormayoccur.PoweredbyShowingTime10K. | 2


