
Page 14 - 8th Grade EOG Prep ans key
P. 14
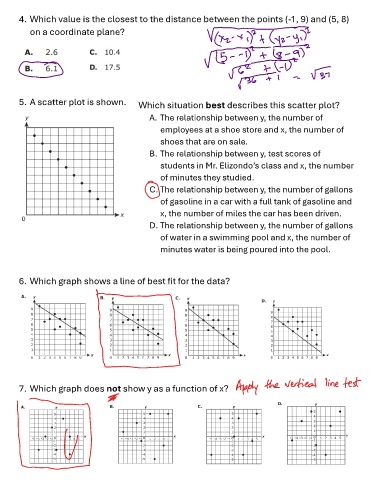
4. Which value is the closest to the distance between the points (-1, 9) and (5, 8)
           on a coordinate plane?


       5. A scatter plot is shown.             Which situation best describes this scatter plot?

                                                  A. The relationship between y, the number of

                                                      employees at a shoe store and x, the number of
                                                      shoes that are on sale.
                                                  B. The relationship between y, test scores of

                                                      students in Mr. Elizondo’s class and x, the number

                                                      of minutes they studied.
                                                  C. The relationship between y, the number of gallons
                                                      of gasoline in a car with a full tank of gasoline and


                                                      x, the number of miles the car has been driven.
                                                  D. The relationship between y, the number of gallons
                                                      of water in a swimming pool and x, the number of

                                                      minutes water is being poured into the pool.


       6. Which graph shows a line of best fit for the data?


       7. Which graph does not show y as a function of x?