
Page 661 - Accounting Principles (A Business Perspective)
P. 661
This book is licensed under a Creative Commons Attribution 3.0 License
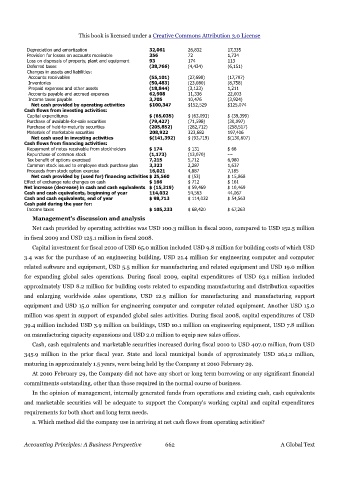
Depreciation and amortization 32,061 26,832 17,335
Provision for losses on accounts receivable 356 72 1,734
Loss on disposals of property, plant and equipment 93 174 113
Deferred taxes (38,766) (4,434) (6,151)
Changes in assets and liabilities:
Accounts receivables (55,101) (27,698) (17,707)
Inventories (50,483) (23,080) (8,758)
Prepaid expenses and other assets (18,844) (3,123) 1,211
Accounts payable and accrued expenses 62,908 11,336 22,003
Income taxes payable 3,705 10,476 (3,924)
Net cash provided by operating activities $100,347 $152,529 $125,074
Cash flows from investing activities:
Capital expenditures $ (65,035) $ (63,091) $ (39,399)
Purchase of available-for-sale securities (79,427) (71,598) (30,097)
Purchase of held-to-maturity securities (205,852) (282,712) (258,517)
Materials of marketable securities 208,922 323,682 197,406
Net cash used in investing activities $(141,392) $ (93,719) $(130,607)
Cash flows from financing activities:
Repayment of notes receivable from stockholders $ 174 $ 131 $ 66
Repurchase of common stock (1,173) (13,070) ---
Tax benefit of options exercised 7,215 5,712 6,980
Common stock issued to employee stock purchase plan 3,323 2,287 1,637
Proceeds from stock option exercise 16,021 4,887 7,185
Net cash provided by (used for) financing activities $ 25,560 $ (53) $ 15,868
Effect of exchange rate changes on cash $ 166 $ 712 $ 161
Net increase (decrease) in cash and cash equivalents $ (15,319) $ 59,469 $ 10,469
Cash and cash equivalents, beginning of year 114,032 54,563 44,067
Cash and cash equivalents, end of year $ 98,713 $ 114,032 $ 54,563
Cash paid during the year for:
Income taxes $ 105,233 $ 68,420 $ 67,263
Management's discussion and analysis
Net cash provided by operating activities was USD 100.3 million in fiscal 2010, compared to USD 152.5 million
in fiscal 2009 and USD 125.1 million in fiscal 2008.
Capital investment for fiscal 2010 of USD 65.0 million included USD 9.8 million for building costs of which USD
3.4 was for the purchase of an engineering building, USD 21.4 million for engineering computer and computer
related software and equipment, USD 5.5 million for manufacturing and related equipment and USD 19.0 million
for expanding global sales operations. During fiscal 2009, capital expenditures of USD 63.1 million included
approximately USD 8.2 million for building costs related to expanding manufacturing and distribution capacities
and enlarging worldwide sales operations, USD 12.5 million for manufacturing and manufacturing support
equipment and USD 15.0 million for engineering computer and computer related equipment. Another USD 15.0
million was spent in support of expanded global sales activities. During fiscal 2008, capital expenditures of USD
39.4 million included USD 3.9 million on buildings, USD 10.1 million on engineering equipment, USD 7.8 million
on manufacturing capacity expansions and USD 2.0 million to equip new sales offices.
Cash, cash equivalents and marketable securities increased during fiscal 2010 to USD 407.0 million, from USD
345.9 million in the prior fiscal year. State and local municipal bonds of approximately USD 264.2 million,
maturing in approximately 1.5 years, were being held by the Company at 2010 February 29.
At 2010 February 29, the Company did not have any short or long term borrowing or any significant financial
commitments outstanding, other than those required in the normal course of business.
In the opinion of management, internally generated funds from operations and existing cash, cash equivalents
and marketable securities will be adequate to support the Company's working capital and capital expenditures
requirements for both short and long term needs.
a. Which method did the company use in arriving at net cash flows from operating activities?
Accounting Principles: A Business Perspective 662 A Global Text