
Page 800 - Accounting Principles (A Business Perspective)
P. 800
This book is licensed under a Creative Commons Attribution 3.0 License
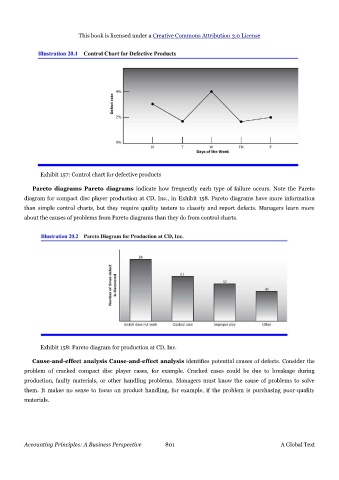
Exhibit 157: Control chart for defective products
Pareto diagrams Pareto diagrams indicate how frequently each type of failure occurs. Note the Pareto
diagram for compact disc player production at CD, Inc., in Exhibit 158. Pareto diagrams have more information
than simple control charts, but they require quality testers to classify and report defects. Managers learn more
about the causes of problems from Pareto diagrams than they do from control charts.
Exhibit 158: Pareto diagram for production at CD, Inc.
Cause-and-effect analysis Cause-and-effect analysis identifies potential causes of defects. Consider the
problem of cracked compact disc player cases, for example. Cracked cases could be due to breakage during
production, faulty materials, or other handling problems. Managers must know the cause of problems to solve
them. It makes no sense to focus on product handling, for example, if the problem is purchasing poor-quality
materials.
Accounting Principles: A Business Perspective 801 A Global Text