
Page 955 - Accounting Principles (A Business Perspective)
P. 955
25. Responsibility accounting: Segmental analysis
Number of employees 50 80 130
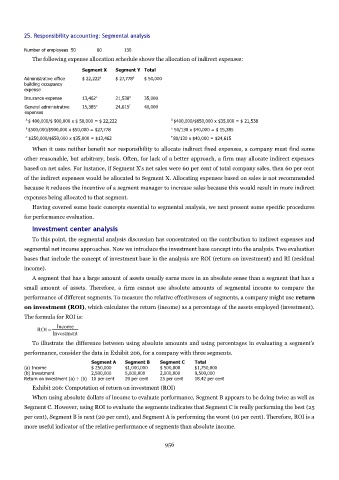
The following expense allocation schedule shows the allocation of indirect expenses:
Segment X Segment Y Total
Administrative office $ 22,222 a $ 27,778 b $ 50,000
building occupancy
expense
Insurance expense 13,462 c 21,538 d 35,000
General administrative 15,385 e 24,615 f 40,000
expenses
A $ 400,000/$ 900,000 x $ 50,000 = $ 22,222 D $400,000/$650,000 x $35,000 = $ 21,538
B $500,000/$900,000 x $50,000 = $27,778 e 50/130 x $40,000 = $ 15,385
c $250,000/$650,000 x $35,000 = $13,462 F 80/130 x $40,000 = $24,615
When it uses neither benefit nor responsibility to allocate indirect fixed expenses, a company must find some
other reasonable, but arbitrary, basis. Often, for lack of a better approach, a firm may allocate indirect expenses
based on net sales. For instance, if Segment X's net sales were 60 per cent of total company sales, then 60 per cent
of the indirect expenses would be allocated to Segment X. Allocating expenses based on sales is not recommended
because it reduces the incentive of a segment manager to increase sales because this would result in more indirect
expenses being allocated to that segment.
Having covered some basic concepts essential to segmental analysis, we next present some specific procedures
for performance evaluation.
Investment center analysis
To this point, the segmental analysis discussion has concentrated on the contribution to indirect expenses and
segmental net income approaches. Now we introduce the investment base concept into the analysis. Two evaluation
bases that include the concept of investment base in the analysis are ROI (return on investment) and RI (residual
income).
A segment that has a large amount of assets usually earns more in an absolute sense than a segment that has a
small amount of assets. Therefore, a firm cannot use absolute amounts of segmental income to compare the
performance of different segments. To measure the relative effectiveness of segments, a company might use return
on investment (ROI), which calculates the return (income) as a percentage of the assets employed (investment).
The formula for ROI is:
Income
ROI=
Investment
To illustrate the difference between using absolute amounts and using percentages in evaluating a segment's
performance, consider the data in Exhibit 206, for a company with three segments.
Segment A Segment B Segment C Total
(a) Income $ 250,000 $1,000,000 $ 500,000 $1,750,000
(b) Investment 2,500,000 5,000,000 2,000,000 9,500,000
Return on investment (a) ÷ (b) 10 per cent 20 per cent 25 per cent 18.42 per cent
Exhibit 206: Computation of return on investment (ROI)
When using absolute dollars of income to evaluate performance, Segment B appears to be doing twice as well as
Segment C. However, using ROI to evaluate the segments indicates that Segment C is really performing the best (25
per cent), Segment B is next (20 per cent), and Segment A is performing the worst (10 per cent). Therefore, ROI is a
more useful indicator of the relative performance of segments than absolute income.
956