
Page 969 - Accounting Principles (A Business Perspective)
P. 969
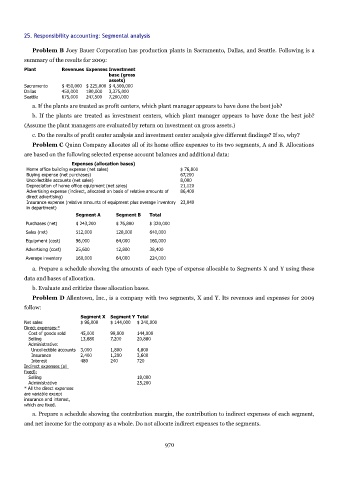
25. Responsibility accounting: Segmental analysis

            Problem B Joey Bauer Corporation has production plants in Sacramento, Dallas, and Seattle. Following is a
          summary of the results for 2009:
          Plant        Revenues Expenses Investment
                                       base (gross
                                       assets)
          Sacramento   $ 450,000 $ 225,000 $ 4,500,000
          Dallas       450,000  180,000  3,375,000
          Seattle      675,000  247,500  7,200,000
            a. If the plants are treated as profit centers, which plant manager appears to have done the best job?

            b. If the plants are treated as investment centers, which plant manager appears to have done the best job?
          (Assume the plant managers are evaluated by return on investment on gross assets.)
            c. Do the results of profit center analysis and investment center analysis give different findings? If so, why?
            Problem C Quinn Company allocates all of its home office expenses to its two segments, A and B. Allocations
          are based on the following selected expense account balances and additional data:
                          Expenses (allocation bases)
          Home office building expense (net sales)              $ 76,800
          Buying expense (net purchases)                        67,200
          Uncollectible accounts (net sales)                    8,000
          Depreciation of home office equipment (net sales)     21,120
          Advertising expense (indirect, allocated on basis of relative amounts of   86,400
          direct advertising)
          Insurance expense (relative amounts of equipment plus average inventory  23,040
          in department)
                            Segment A     Segment B   Total
          Purchases (net)   $ 243,200     $ 76,800    $ 320,000
          Sales (net)       512,000       128,000     640,000
          Equipment (cost)  96,000        64,000      160,000
          Advertising (cost)  25,600      12,800      38,400
          Average inventory  160,000      64,000      224,000
            a. Prepare a schedule showing the amounts of each type of expense allocable to Segments X and Y using these
          data and bases of allocation.
            b. Evaluate and criticize these allocation bases.
            Problem D Allentown, Inc., is a company with two segments, X and Y. Its revenues and expenses for 2009

          follow:
                             Segment X  Segment Y Total
          Net sales          $ 96,000   $ 144,000  $ 240,000
          Direct expenses:*
             Cost of goods sold  45,000  99,000  144,000
             Selling         13,680     7,200    20,880
             Administrative:
               Uncollectible accounts  3,000  1,800  4,800
               Insurance     2,400      1,200    3,600
               Interest      480        240      720
          Indirect expenses (all
          fixed):
             Selling                             18,000
             Administrative                      25,200
          * All the direct expenses
          are variable except
          insurance and interest,
          which are fixed.
            a. Prepare a schedule showing the contribution margin, the contribution to indirect expenses of each segment,
          and net income for the company as a whole. Do not allocate indirect expenses to the segments.


                                                           970