
Page 47 - Towards A Sustainable Future , Phase 3 2025, E-Book_Neat
P. 47
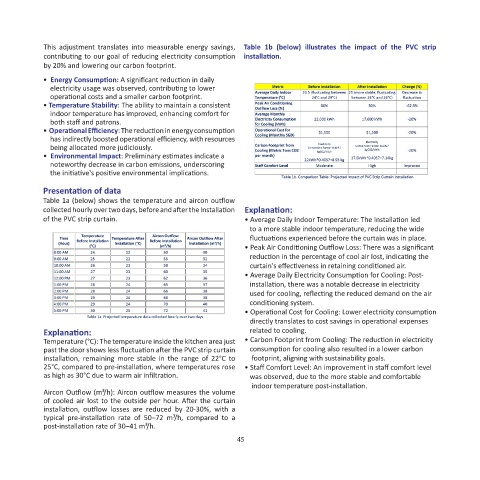
This  adjustment  translates  into  measurable  energy  savings,  Table  1b  (below)  illustrates  the  impact  of  the  PVC  strip
            contributing to our goal of reducing electricity consumption  installation.
            by 20% and lowering our carbon footprint.
            •  Energy Consumption: A significant reduction in daily
                electricity usage was observed, contributing to lower
                operational costs and a smaller carbon footprint.
            • Temperature Stability: The ability to maintain a consistent
                indoor temperature has improved, enhancing comfort for
                both staff and patrons.
            •  Operational Efficiency: The reduction in energy consumption
                 has indirectly boosted operational efficiency, with resources
                being allocated more judiciously.
            •  Environmental Impact: Preliminary estimates indicate a
                noteworthy decrease in carbon emissions, underscoring
                the initiative's positive environmental implications.

            Presentation of data
            Table 1a (below) shows the temperature and aircon outflow
            collected hourly over two days, before and after the Installation  Explanation:
            of the PVC strip curtain.                            • Average Daily Indoor Temperature: The Installation led
                                                                    to a more stable indoor temperature, reducing the wide
                                                                    fluctuations experienced before the curtain was in place.
                                                                 • Peak Air Conditioning Outflow Loss: There was a significant
                                                                    reduction in the percentage of cool air lost, indicating the
                                                                    curtain's effectiveness in retaining conditioned air.
                                                                 • Average Daily Electricity Consumption for Cooling: Post-
                                                                    installation, there was a notable decrease in electricity
                                                                    used for cooling, reflecting the reduced demand on the air
                                                                    conditioning system.
                                                                 • Operational Cost for Cooling: Lower electricity consumption
                                                                    directly translates to cost savings in operational expenses
            Explanation:                                            related to cooling.
            Temperature (°C): The temperature inside the kitchen area just   • Carbon Footprint from Cooling: The reduction in electricity
            past the door shows less fluctuation after the PVC strip curtain     consumption for cooling also resulted in a lower carbon
            installation,  remaining  more  stable  in  the  range  of  22°C  to      footprint, aligning with sustainability goals.
            25°C, compared to pre-installation, where temperatures rose  • Staff Comfort Level: An improvement in staff comfort level
            as high as 30°C due to warm air infiltration.           was observed, due to the more stable and comfortable
                                                                     indoor temperature post-installation.
            Aircon Outflow (m³/h): Aircon outflow measures the volume
            of cooled air lost to the outside per hour. After the curtain
            installation,  outflow  losses  are  reduced  by  20-30%,  with  a
            typical  pre-installation  rate  of  50–72  m³/h,  compared  to  a
            post-installation rate of 30–41 m³/h.

                                                               45