
Page 31 - Ranger Demo
P. 31
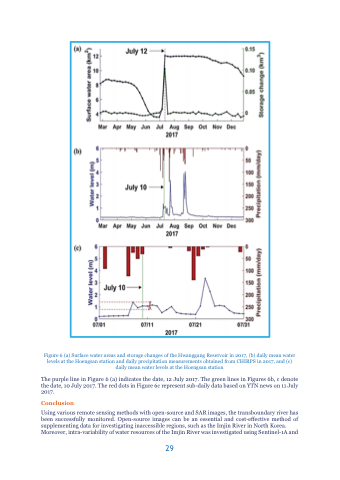
Figure 6 (a) Surface water areas and storage changes of the Hwanggang Reservoir in 2017, (b) daily mean water levels at the Hoengsan station and daily precipitation measurements obtained from CHIRPS in 2017, and (c) daily mean water levels at the Hoengsan station
The purple line in Figure 6 (a) indicates the date, 12 July 2017. The green lines in Figures 6b, c denote the date, 10 July 2017. The red dots in Figure 6c represent sub-daily data based on YTN news on 11 July 2017.
Conclusion
Using various remote sensing methods with open-source and SAR images, the transboundary river has been successfully monitored. Open-source images can be an essential and cost-effective method of supplementing data for investigating inaccessible regions, such as the Imjin River in North Korea. Moreover, intra-variability of water resources of the Imjin River was investigated using Sentinel-1A and
29
