
Page 29 - Ranger Demo
P. 29
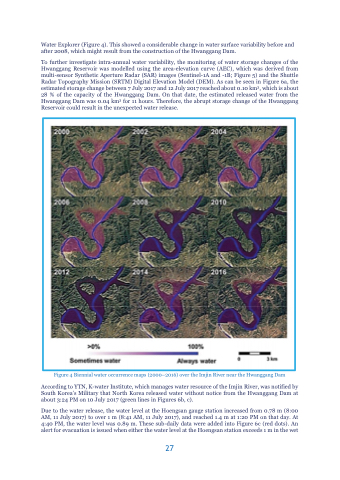
Water Explorer (Figure 4). This showed a considerable change in water surface variability before and after 2008, which might result from the construction of the Hwanggang Dam.
To further investigate intra-annual water variability, the monitoring of water storage changes of the Hwanggang Reservoir was modelled using the area-elevation curve (AEC), which was derived from multi-sensor Synthetic Aperture Radar (SAR) images (Sentinel-1A and -1B; Figure 5) and the Shuttle Radar Topography Mission (SRTM) Digital Elevation Model (DEM). As can be seen in Figure 6a, the estimated storage change between 7 July 2017 and 12 July 2017 reached about 0.10 km3, which is about 28 % of the capacity of the Hwanggang Dam. On that date, the estimated released water from the Hwanggang Dam was 0.04 km3 for 11 hours. Therefore, the abrupt storage change of the Hwanggang Reservoir could result in the unexpected water release.
Figure 4 Biennial water occurrence maps (2000–2016) over the Imjin River near the Hwanggang Dam
According to YTN, K-water Institute, which manages water resource of the Imjin River, was notified by South Korea’s Military that North Korea released water without notice from the Hwanggang Dam at about 3:24 PM on 10 July 2017 (green lines in Figures 6b, c).
Due to the water release, the water level at the Hoengsan gauge station increased from 0.78 m (8:00 AM, 11 July 2017) to over 1 m (8:41 AM, 11 July 2017), and reached 1.4 m at 1:20 PM on that day. At 4:40 PM, the water level was 0.89 m. These sub-daily data were added into Figure 6c (red dots). An alert for evacuation is issued when either the water level at the Hoengsan station exceeds 1 m in the wet
27
