
Page 28 - Ranger Demo
P. 28
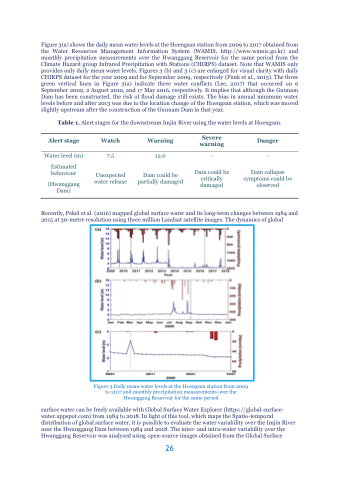
Figure 3(a) shows the daily mean water levels at the Hoengsan station from 2009 to 2017 obtained from the Water Resources Management Information System (WAMIS, http://www.wamis.go.kr) and monthly precipitation measurements over the Hwanggang Reservoir for the same period from the Climate Hazard group Infrared Precipitation with Stations (CHIRPS) dataset. Note that WAMIS only provides only daily mean water levels. Figures 3 (b) and 3 (c) are enlarged for visual clarity with daily CHIRPS dataset for the year 2009 and for September 2009, respectively (Funk et al., 2015). The three green vertical lines in Figure 3(a) indicate three water conflicts (Lee, 2017) that occurred on 6 September 2009, 2 August 2010, and 17 May 2016, respectively. It implies that although the Gunnam Dam has been constructed, the risk of flood damage still exists. The bias in annual minimum water levels before and after 2013 was due to the location change of the Hoengsan station, which was moved slightly upstream after the construction of the Gunnam Dam in that year.
Table 1. Alert stages for the downstream Imjin River using the water levels at Hoengsan.
Alert stage
Water level (m)
Estimated behaviour
(Hwanggang Dam)
Watch
7.5
Unexpected water release
Warning
12.0
Dam could be partially damaged
Severe warning
-
Dam could be critically damaged
Danger
-
Dam collapse symptoms could be observed
Recently, Pekel et al. (2016) mapped global surface water and its long-term changes between 1984 and 2015 at 30-metre resolution using three million Landsat satellite images. The dynamics of global
surface water can be freely available with Global Surface Water Explorer (https://global-surface- water.appspot.com) from 1984 to 2018. In light of this tool, which maps the Spatio-temporal distribution of global surface water, it is possible to evaluate the water variability over the Imjin River near the Hwanggang Dam between 1984 and 2018. The inter- and intra-water variability over the Hwanggang Reservoir was analysed using open-source images obtained from the Global Surface
Figure 3 Daily mean water levels at the Hoengsan station from 2009 to 2017 and monthly precipitation measurements over the Hwanggang Reservoir for the same period
26
