
Page 27 - 2021 Academic Achievement and Growth Report
P. 27
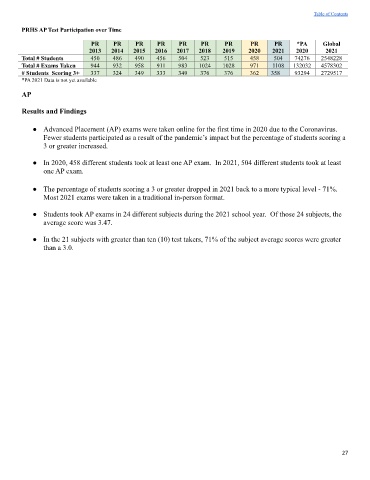
Table of Contents


        PRHS AP Test Participation over Time
                               PR      PR     PR     PR     PR     PR      PR       PR      PR     *PA      Global
                               2013   2014   2015   2016    2017   2018    2019    2020    2021    2020      2021
        Total # Students       450    486     490    456    504    523     515      458     504   74276    2548228
        Total # Exams Taken    944    932     958    911    983    1024    1028     971    1108   132032   4578302
        # Students  Scoring 3+  337   324     349    333    349    376     376      362    358    93294    2729517
        *PA 2021 Data is not yet available

        AP

        Results and Findings


            ● Advanced Placement (AP) exams were taken online for the first time in 2020 due to the Coronavirus.
               Fewer students participated as a result of the pandemic’s impact but the percentage of students scoring a
               3 or greater increased.


            ● In 2020, 458 different students took at least one AP exam.  In 2021, 504 different students took at least
               one AP exam.


            ● The percentage of students scoring a 3 or greater dropped in 2021 back to a more typical level - 71%.
               Most 2021 exams were taken in a traditional in-person format.

            ● Students took AP exams in 24 different subjects during the 2021 school year.  Of those 24 subjects, the
               average score was 3.47.

            ● In the 21 subjects with greater than ten (10) test takers, 71% of the subject average scores were greater
               than a 3.0.


                                                                                                                  27