Page 12 - Appraisal 39 Falcon Parade Nickol
P. 12

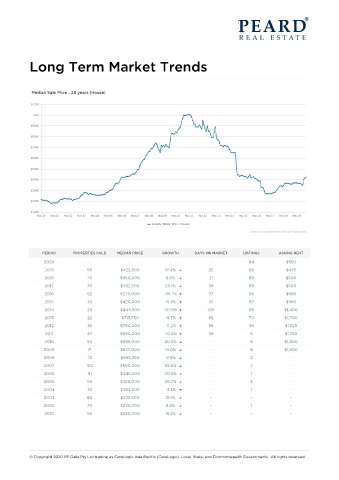
Long Term Market Trends


                PERIOD     PROPERTIES SOLD  MEDIAN PRICE  GROWTH     DAYS ON MARKET   LISTINGS     ASKING RENT
                2020            -             -              -             -            64           $550
                 2019           56         $422,500        17.4%          22            88           $475
                 2018           79         $360,000        8.3%           21            89           $500
                 2017           70         $332,500        23.1%          39            99           $500
                 2016           52         $270,000        -35.7%         77            95           $650
                 2015           33         $420,000        -5.3%          51            97           $950
                 2014           24         $443,500        -37.9%         100           93           $1,400
                 2013           22          $713,750       -9.7%          82            70           $1,700
                 2012           36         $790,000        -11.2%         58            39           $1,825
                 2011           47         $890,000        -10.6%         39             5           $1,750
                 2010           54         $995,000        20.3%           -             6           $1,800
                2009            71         $827,000        19.0%           -             16          $1,800
                2008            72         $695,250        17.8%           -             12            -
                2007           103         $590,000        32.6%           -             2             -
                2006            111        $445,000        20.9%           -             1             -
                2005            59         $368,000        39.7%           -             3             -
                2004            72         $263,500        -3.3%           -             1             -
                2003            80         $272,500        21.1%           -             -             -
                2002            70         $225,000        2.3%            -             1             -
                 2001           53         $220,000        19.2%           -             -             -


           © Copyright 2020 RP Data Pty Ltd trading as CoreLogic Asia Pacific (CoreLogic), Local, State, and Commonwealth Governments.  All rights reserved.
   7   8   9   10   11   12   13   14   15   16   17