Page 13 - CMA-Report-5-Schooner-Street-Baynton-WA
P. 13

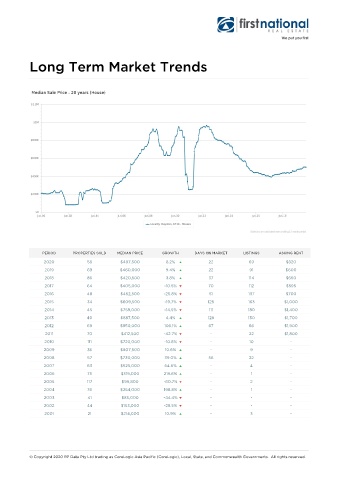
Long Term Market Trends


                PERIOD     PROPERTIES SOLD  MEDIAN PRICE  GROWTH     DAYS ON MARKET   LISTINGS     ASKING RENT
                2020            58         $497,500        8.2%           22            69           $820
                 2019           69         $460,000        9.4%           22             91          $600
                 2018           86         $420,500        3.8%           37            114          $650
                 2017           64         $405,000        -10.5%         70            112          $595
                 2016           48         $452,500        -25.8%         51            137          $700
                 2015           34         $609,500        -19.7%         125           163          $1,000
                 2014           45         $759,000        -14.5%         111           180          $1,400
                 2013           40         $887,500        4.4%           128           130          $1,700
                 2012           69         $850,000        106.1%         67            66           $1,900
                 2011           70          $412,500       -42.7%          -            22           $1,800
                 2010           111        $720,000        -10.8%          -             10            -
                2009            36         $807,500        10.6%           -             9             -
                2008            57         $730,000        39.0%          56            22             -
                2007            63         $525,000        64.6%           -             4             -
                2006            75         $319,000        219.6%          -             1             -
                2005            117         $99,800       -60.7%           -             2             -
                2004            76         $254,000        198.8%          -             1             -
                2003            41          $85,000       -44.4%           -             -             -
                2002            44         $153,000        -28.5%          -             -             -
                 2001           21         $214,000        10.9%           -             3             -


           © Copyright 2020 RP Data Pty Ltd trading as CoreLogic Asia Pacific (CoreLogic), Local, State, and Commonwealth Governments.  All rights reserved.
   8   9   10   11   12   13   14   15