Page 11 - Appraisal 2 Featherby Way Baynton
P. 11

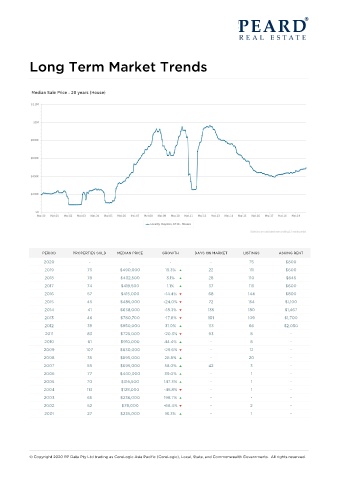
Long Term Market Trends


                PERIOD     PROPERTIES SOLD  MEDIAN PRICE  GROWTH     DAYS ON MARKET   LISTINGS     ASKING RENT
                2020            -             -              -             -            75           $800
                 2019           73         $490,000        13.3%          22             111         $600
                 2018           78         $432,500        3.1%           28            110          $645
                 2017           74         $419,500         1.1%          37            113          $600
                 2016           57         $415,000        -14.4%         68            144          $800
                 2015           45         $485,000       -24.0%          72            154          $1,100
                 2014           41         $638,000        -18.3%         135           180          $1,467
                 2013           46         $780,700        -17.8%         101           109          $1,700
                 2012           39         $950,000        31.0%          113           66           $2,050
                 2011           83         $725,000        -20.3%         93             8             -
                 2010           61         $910,000        44.4%           -             8             -
                2009           107         $630,000        -29.6%          -             12            -
                2008            35         $895,000        28.8%           -            20             -
                2007            59         $695,000        58.0%          42             3             -
                2006            77         $440,000        39.0%           -             1             -
                2005            70          $316,500       147.3%          -             1             -
                2004            113        $128,000        -45.8%          -             1             -
                2003            65         $236,000        198.7%          -             -             -
                2002            52          $79,000       -66.4%           -             2             -
                 2001           27         $235,000        16.3%           -             1             -


           © Copyright 2020 RP Data Pty Ltd trading as CoreLogic Asia Pacific (CoreLogic), Local, State, and Commonwealth Governments.  All rights reserved.
   6   7   8   9   10   11   12   13   14   15   16