
Page 2 - Earthworks Recording Guide
P. 2
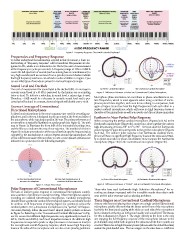
Figure 1. Frequency Response Chart with Extended keyboard

Frequencies and Frequency Response                                                                                                                           -10dB loss
                                                                                                                                                             at 16kHz
To better understand the information covered in this document, a basic un-
derstanding of “frequency response” will be beneficial. Frequencies are des-                                                                                 -17dB loss
ignated in Hz, which is an abbreviation for Hertz (the unit of measurement                                                                                   at 20kHz
of the frequency in cycles per second). A frequency range of 1Hz to 100kHz
covers the full spectrum of sounds (such as a string bass or contrabassoon) to
very high sounds (such as overtones from a piccolo). Recent studies indicate
that high frequency overtones can extend to as far a 100kHz. In Figure 1 you
can see what types of sounds are present in various frequency ranges.

Sound Level and Decibels                                                           (a) Perfect Cardioid Microphone     (b) Conventional Cardioid Microphone

The unit of measurement for sound level is the decibel (dB). An increase in        Figure 3. Differences Between a Perfect and Conventional Cardioid Microphone
acoustic sound level of +10 dB is perceived by the human ear as sounding
twice as loud. To indicate a reduction in sound level, a minus sign is used.       Microphone phase anomalies can contribute to phase cancellations at cer-
Therefore, –10dB would be a decrease in acoustic sound level and is per-           tain frequencies, which is most apparent when using a number of micro-
ceived as half as loud. In contrast, electrical signals will double every +6dB.    phones placed close together, such as in drum miking. In comparison, look
                                                                                   again at Figure 3a and see how the high frequencies track each other in a
Uneven Coverage of Conventional                                                    perfect cardioid microphone, which will cause no high frequency losses at
Directional Microphones                                                            the sides of the microphone as well as no peaks and dips or phase anomalies.

A directional microphone is the most common type used for recording ap-            Earthworks Near-Perfect Polar Response
plications, and in theory, is designed to pick up sound at the front and sides of
the microphone, while rejecting sounds at the rear. The polar performance of       When comparing the perfect cardioid microphone (Figures 3a & 4a) to the
a microphone is typically illustrated on a polar graph (see Figure 2). The pink    Earthworks microphone (Figure 4b), notice how close together the various
area in Figure 2a illustrates the front half of the microphone’s pickup area,      high frequencies are from 270° to 0° to 90°. See how close the Earthworks
and the blue area indicates the area of rear rejection. The numbered circles in    polar response (Figure 4b) corresponds to the perfect microphone (Figures
Figure 2b indicate any reduction of the sound level (at specific frequencies) as   3a & 4a). The uniform polar response of an Earthworks cardioid micro-
captured by the microphone at various degrees around the microphone. All           phone will have no significant high frequency losses at the sides and virtual-
of this will become more relevant when you see a microphone’s performance          ly no phase anomalies or phase cancellations. Now compare the Earthworks
indicated on a polar chart in the following examples.                              microphone (Figure 4b) to the conventional microphone (Figure 3b).

(a) Polar chart showing front and  (b) Polar chart showing decrease in             (a) Perfect Directional Microphone  (b) Earthworks Directional Microphone
    rear areas of a microphone         sound level in dB from inner circles

Figure 2. A Basic Polar Chart                                                      Figure 4. Differences Between a “Perfect” and an Earthworks Directional Microphone

Polar Response of Conventional Microphones                                         Those who have used Earthworks High Definition Microphones™ for re-
                                                                                   cording are always impressed with the incredible results they obtain with
The lack of uniform polar response of conventional microphones contrib-            near-perfect polar response and no phasing problems.
utes a number of problems in sound recording. Most microphones used for
recording are cardioid (directional) microphones. Cardioid microphones             Three Singers on a Conventional Cardioid Microphone
should follow a particular cardioid (heart shaped) pattern, and ideally should
be uniform at all frequencies at varying degrees (or positions) around the         Anyone who has tried placing three singers on a single cardioid (directional)
cardioid pattern. For a directional microphone to be “perfect,” all frequen-       microphone quickly discovers that the singer at the front of the microphone
cies must precisely follow the exact heart-shaped pickup pattern as shown          has by far the best sound quality, while those on each side of the microphone
in Figure 3a. Referring to the “Conventional Cardioid Microphone” in Fig-          have a dramatic reduction in both sound quality and sound level. The reason
ure 3b, we see that different high frequencies vary significantly in level (i.e.   for this is illustrated in Figure 5. The singer directly at the front is the only
4kHz, 16kHz and 20kHz). Such level disparities between the different high          one enjoying the full frequency response of the microphone (shown in the
frequencies correspond to peaks or dips (increases or decreases in level) in       pink shaded area), while both singers at the sides sound like their mouths are
the microphone’s overall frequency response, which causes high frequency           covered. This is due to high frequency losses (shown with the dotted blue line)
losses at the sides of the microphone and can also create phasing problems.        outside the pink shaded area. The two singers on the sides have a -12dB loss