
Page 12 - (E-Brochure Version) Is a good or bad time to invest in property
P. 12
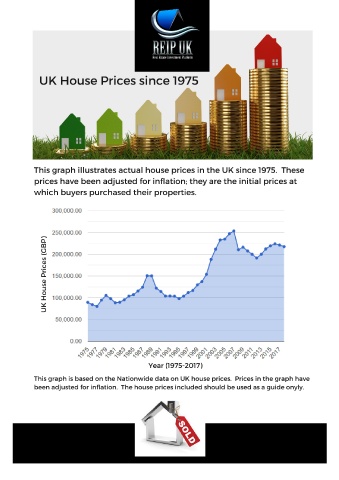
UK House Prices since 1975


             This graph illustrates actual house prices in the UK since 1975.  These
             prices have been adjusted for inflation; they are the initial prices at

             which buyers purchased their properties.


                 )
                 P
                 B
                 G
                 (

                 s
                 e
                 c
                 i
                 r
                 P

                 e
                 s
                 u
                 o
                 H

                 K
                 U


                                                     Year (1975-2017)
             This graph is based on the Nationwide data on UK house prices.  Prices in the graph have
             been adjusted for inflation.  The house prices included should be used as a guide onyly.