
Page 12 - June 2020 - Is it a good time or bad time to invest in property - Brochure Final
P. 12
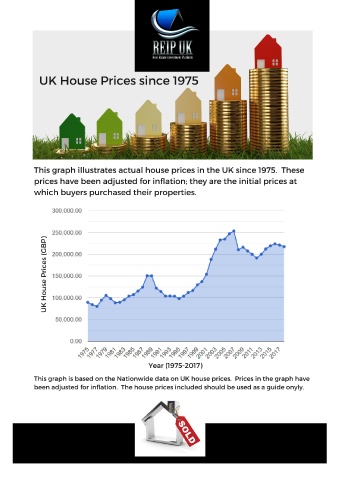
UK House Prices since 1975


             This graph illustrates actual house prices in the UK since 1975.  These
             prices have been adjusted for inflation; they are the initial prices at

             which buyers purchased their properties.


                 )
                 P
                 B
                 G
                 (

                 s
                 e
                 c
                 i
                 r
                 P

                 e
                 s
                 u
                 o
                 H

                 K
                 U


                                                     Year (1975-2017)
             This graph is based on the Nationwide data on UK house prices.  Prices in the graph have
             been adjusted for inflation.  The house prices included should be used as a guide onyly.