
Page 7 - White Paper
P. 7
Average Hourly earnings All employees Wood Products Mfg.
2001-2010
2007: $16.34
2008: $16.98
2009: $17.68
2010: $17.34
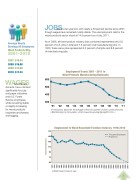
employment trends 2001 - 2011 in Wood Products Manufacturing nationally
WAGES
600
ov
er th
e la
st
decade, have climbed 500
significantly for pulp and paper industries and U.S. Forest Service employees, while remaining stable or slightly increasing for wood products industries and forestry and logging.
400 300
JOBS
though wages have remained mostly stable. The unemployment rate for the wood products sector stood at 14.5 percent as of July, 2011.
As of 2006, all forest product industry jobs combined represented only 0.6 percent of U.S. jobs in total and 7.3 percent of all manufacturing jobs. In 1950, these same jobs represented 2.5 percent of all jobs and 8.6 percent of manufacturing jobs.
170
150
130
110
90 70 50
a
re at a ten year low, with nearly a 50 percent decline since 2001,
‘01 ‘02 ‘03
‘04 ‘05
‘06 ‘07
‘08 ‘09
‘10 ‘11
*In thousands, based on the average of first two quarters of each consecutive year ( BEA Earnings by Occupation <http://www.bls.gov/iag/tgs/iag321.htm> )
employment in Wood Household Furniture Industry, 1978-2010
Thousand Employees Projections
*USDA Forest Products Lab
7
1978 1979 1980 1981 1982 1983 1984 1985 1986 1987 1988 1989 1990 1991 1992 1993 1994 1995 1996 1997 1998 1999 2000 2001 2002 2003 2004 2005 2006 2007 2008 2009 2010
thousand employees
